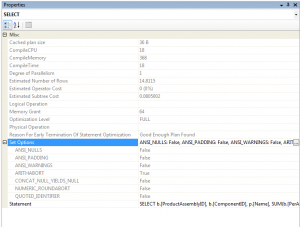
I ran across a few more properties visible in the exec plan that I thought would be useful to people. So, without further ado…
Some overall properties of the entire execution can be seen by selecting the highest-level operator in the plan (the one on the left-most, typically the select, insert, update or delete operator) and then opening the properties window
The first four items, the compild plan size, compile CPU, compile Time and compile Memory all refer to the optimisation process that the query went through. They indicate how much in the way of server resources was spent compiling this query and how large the cached plan is in memory.
This can be important when dealing with queries that recompile often or are very seldom reused
The degree of parallelism shows the actual number of processors used to execute the query. It’s only of interest if the query runs paralleled.
The memory grant shows the amount of memory that the query processor needed to execute the query. This is typically for things like hashs or sorts. This may be useful for debugging memory consumption issues or insufficient memory errors
The Optimisation Level and Reason for Early Termination describe the level to which the query was optimised. The optimiser is only permitted a certain about of time to optimise a query. That time is based on the complexity of the query. Those two properties indicate whether the optimiser was able to find a sufficiently good plan in the time allowed, or if it was forced to bail out and pick the best plan so far found. The Reason for Early Termination property is not always present
The section on set options shows what various connection properties were set to when the query ran. This can be very handy for seeing why some cached plans are not getting reused.
Finally, on SQL 2008 there are two more properties listed. Query hash and Query plan hash. For the low down on that, see this rticle by Bard Duncan – Query Fingerprints and Plan Fingerprints (The Best SQL 2008 Feature That You’ve Never Heard Of)
I think that’s enough theory on execution plans (please comment if you disagree). The next couple of articles in this series will be examples of reading execution plans.

Hi,
Again great post. Another doubt.
I use SQL 2000. So, does the ‘sub tree cost’ property specified in the left corner applies to the entire cost of the query?
Thanks in advance
The subtree cost is the cost of that operator plus all the operators beneath it in the tree. The subtree cost on the top-most operator will be the cost of the entire query.
thank you for ur lightening fast response
Dear Gail:
Could you please help me below issues?
1、When We use different ways to write the script,How to know which SQL statments is more optimization by the executed plan?
2、what’s the mearsuring unit of the I/O Cost、CPU Cost、subtree Cost and Cost?
3、is there any mathematic equation among these costs?
4、How to comput the total accurate time by the execution plan?
1) Generally the cost, along with the output of stats IO and Stats time
2) There isn’t one
3) Probably, but you’d have to ask the SQL development team as it’s not public
4) You can’t.
Hi,
Is there one indicator that I can use to compare the efficiency of two queries
There’s no single indicator that shows that one query is more efficient than another. Look at the query cost, the output of Statistics IO and the cpu time and duration from Statistics Time