It is sometimes said that trivial execution plans are not cached and queries that have such plans are compiled on every execution. So is that true? To effectively answer this question, we must first establish what a trivial plan is.
A trivial plan is essentially a plan for a query where a specific plan will always be the most optimal way of executing it. If we consider something like SELECT * FROM SomeTable then there’s only one real way to execute it, a scan of the cluster/heap.
The trivial plan is somewhat of a query optimiser optimisation. If the query qualifies for a trivial plan (and there are lots of restrictions) then the full optimisation process doesn’t need to be started and so the query’s execution plan can be generated quicker and with less overhead. The fact that a query has a trivial plan at one point doesn’t necessarily mean that it will always have a trivial plan, indexes may be added that make the selection of plan less of a sure thing and so the query must go for full optimisation, rather than getting a trivial plan
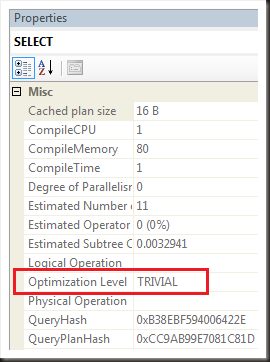
Nice theory, but how does one tell if a particular query has a trivial execution plan? The information is found within the execution plan, the properties of the highest-level operator has an entry ‘Optimisation level’ For a trivial plan this will read ‘TRIVIAL’

It’s also, for the brave people who like XML, found within the xml form of the plan
<StmtSimple StatementCompId='1' StatementEstRows='11' StatementId='1' StatementOptmLevel='TRIVIAL' StatementSubTreeCost='0.0032941' StatementText='SELECT * FROM forums' StatementType='SELECT' QueryHash='0xB38EBF594006422E' QueryPlanHash='0xCC9AB99E7081C81D'>
<!-- most of the rest of the plan here -->
</StmtSimple>
So, are they cached? The way to find that out is to run a variety of queries and see what’s sitting in the cache afterwards.
I’m going to clear the procedure cache then run a couple queries against the AdventureWorks database, checking the graphical execution plan for each one. After they’ve all been run, I’ll query the plan cache and check the optimisation level of the cached plans,
Query 1:
SELECT FirstName, LastName
    FROM Person.Person
    WHERE BusinessEntityID = 42
According to the graphical plan, this query has a trivial plan.
Query 2:
SELECT TOP (10) Name FROM Production.Product
According to the graphical plan, this query also has a trivial plan.
Query 3:
SELECT * FROM Sales.SalesOrderHeader sh
    INNER JOIN sales.SalesOrderDetail sd
        ON sh.SalesOrderID = sd.SalesOrderID
    WHERE sh.ShipDate > '2008/05/25'
According to the graphical plan, this query has a non-trivial plan, the optimisation level is listed as full.
SELECT st.text, qp.query_plan,
     qp.query_plan.value('
       declare default element
       namespace "http://schemas.microsoft.com/sqlserver/2004/07/showplan";
       (//StmtSimple/@StatementOptmLevel)[1]','varchar(20)') AS OptimisationLevel
    FROM sys.dm_exec_cached_plans cp
        CROSS APPLY sys.dm_exec_query_plan(cp.plan_handle) qp
        CROSS APPLY sys.dm_exec_sql_text(cp.plan_handle) st
    WHERE text not like '%sys.dm_exec_cached_plans%'
This returns 4 rows. All three of the queries that I ran against AdventureWorks, two with optimisation levels of Trivial, one with an optimisation level of Full, and the unparameterised ‘shell’ of the first of the queries.
So it appears that some trivial plans are indeed cached.
“So it appears that trivial plans are indeed cached”
A fact that isn’t trivial 😉
Nice job.
Interesting indeed. I guess simple parameterized queries are not the only trival plans cached. Thanks for the post.
When “some” trivial plans are cached, does it mean “some” are not cached?
I seem to recall reading, early in the 2005 betas, that some were and some weren’t. Can’t recall details. Will hunt for document/statement
Also, you can see that as me being safe. If I say ‘all’ someone’s bound to find an example that isn’t. It’s worth noting that all queries marked OPTION (RECOMPILE) are not cached, regardless of what optimisation level they had