Author Archive: Gail

Jobs that beat the caring out of you

Ok, Since Jen and Grant started this, it’s time to share some horrors…

This happened during the five or so years I was doing consulting type work with a small consulting company (which was itself a bad idea, but that’s a whole ‘nother story). Work was a tad on the sparse side at the time and I was looking for anything. Enter a logistics company that needed some integration work doing.

SSIS and ETL work for a couple months. Not ideal, but how bad could it be?

Bad. Very bad indeed, and mostly because of management. There’s one thing at least I can say about this place, they taught me how not to manage an IT department.

I’m not going to cover everything that happened at that place, just some aspects of one project. It was a package tracking system, intended to take waybill data, vehicle tracking and some other bits and pieces and make it so that any delivery/shipment could be identified as being in a warehouse or on a truck, and specifically which warehouse or truck.

First problem. It was 6 months of work at least. We had 6 weeks. Not 6 weeks to a deadline that everyone understood was going to be missed. 6 weeks to the date that the company CEO had been told this new tracking system would be in use. Nothing that can possibly go wrong there.

First problem, the project manager. He managed by gantt chart, but that’s not all that uncommon. What was less common was that he appeared to have no concept of time management at all. I worked for them 3 days a week. During one Monday afternoon project meeting, I gave the project manager an estimate of 10 days for chunk of work. I found out later that day that he’d promised it would be in production the following week Thursday. 10 calendar days from the time he was given an estimate, at a point where I’d have had 5 working days to finish it.

That got me yelled at by the head of IT.

Second problem. The project manager and BI specialist (read Excel report writer). They both repeatedly agreed on things in meetings, and then told the head of IT something completely different, something that cast them in a good light and the developers as incompetent idiots. Once is an accident, twice might be coincidence. Three times or more however…

I got into the habit of openly recording the meetings on my phone (for ‘documentation purposes’)

Third problem. The head of IT. I’d say she was a little on the side of micromanaging, but that would be like saying a Joburg thunderstorm is a tad damp. She also had a tendency to overreact, and to listen to only one side of a story before reacting.

The last straw of that particular project was the Monday when the project manager decided that the system we were working on was going into UAT for user testing (not testers, business users). It was not in any way ready and I told him that in the meeting, as did the other developer. After listening to out explanations he agreed and said he’d get another week. It might have been enough.

Next thing I know one of the other devs tells me that the head of IT wanted a word.

No, she didn’t want a word. She wanted to scream at me for over 5 minutes, at the top of her voice, in an open plan office, in front of everyone else about how irresponsible it was to suggest that the project was ready for UAT over the project manager’s recommendations, tell me how incompetent I was, how useless I was, what a terrible developer I was, that I was a liar, lazy, and that she would have me fired and ensure I never got another IT job.

I didn’t walk out. Not quite, but I did call my boss immediately afterwards. See, I didn’t work for her. I was doing the work on contract. She couldn’t fire me.

My boss at the time was the softest spoken person I know, he never raised his voice, never lost his temper, never sounded irritated no matter what. That afternoon, when he had to drop all the other work he had planned and come out to the logistics company, that afternoon I heard him angry.

Somehow the logistics company is still in business. I have no idea how.

Comparing plans in Management Studio

Previously I looked at using Query Store to compare execution plans, but it’s not the only way that two execution plans can be compared. The other method requires a saved execution plan and the Management Studio execution plan viewer.

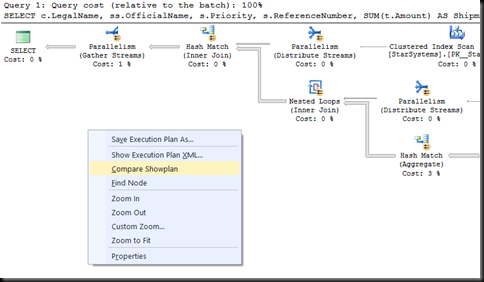
Let’s start by assuming I have a saved execution plan for a query and I want to compare it to the execution plan that the same query currently has. First step is to run the query with actual execution plan on. Right-click on the execution plan and select ‘Compare Showplan’

ComparePlans2

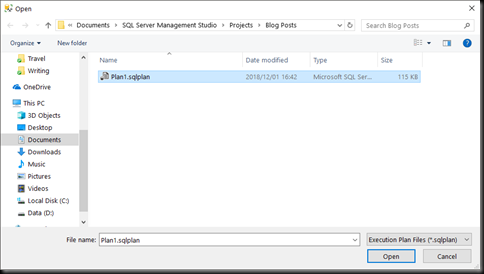
Pick a saved execution plan. It doesn’t have to be for the same query, but the comparison will be of little use if the two plans being compared are not from the same query.

ComparePlansFindPlan

And then we get the same comparison screen as we saw last time with the comparison via Query Store. Similar portions of the plan are marked by coloured blocks, and the properties window shows which properties differ between the two plans.

ComparePlansDetail2

Comparing plans in Query Store

One feature that was added in the 2016 version of SSMS that hasn’t received a lot of attention, is the ability to compare execution plans.

There’s two ways of doing this, from Query Store and from saved files.

Let’s start with Query Store, and I’m going to use a demo database that I’ve been working on for a few months – Interstellar Transport (IST). I’ve got a stored procedure in there that has a terrible parameter sniffing problem (intentionally). I’m going to run it a few times with one parameter value, then run it a few more times with another parameter value, remove the plan from cache and repeat the executions in the reverse order.

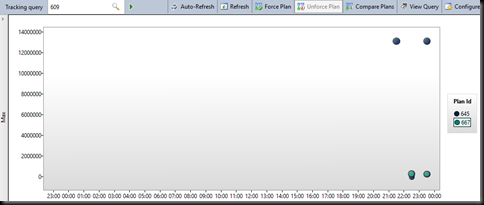
With that done, the query should show up in the ‘Queries with High Variance’ report (SQL 2017)

image

image

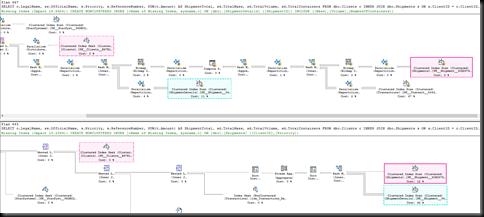
The query has the two expected plans, and they are quite different from each other.

Plan1

Plan2

I can click on the points on the graph individually to see the plans, but comparing the plans in that way is difficult and requires that I make notes somewhere else. What I can do instead is select two different points on the graph and chose the ‘compare plans’ option.

image

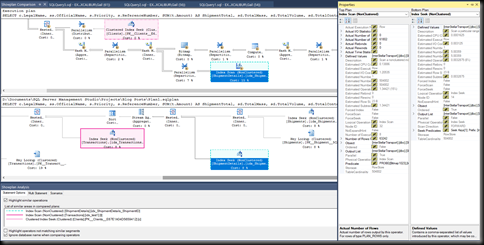
This brings up a window where the two plans are displayed one above the other, and areas in the plan which are similar are highlighted.

image

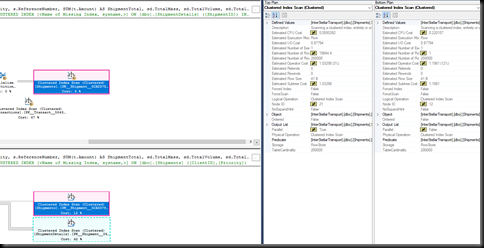
Select an operator and pull up the properties, and the properties of the operator from both plans are shown, with the differences highlighted.

image

This isn’t the only way to compare query plans. The next post will show how it can be done without using Query Store at all.

Books of 2018

I set a reading goal of 75 books again in 2018. Fell a little short, only managed 70. All in all I’m not too unhappy about that.

The full details of all the books read are available on Goodreads’s yearly review https://www.goodreads.com/user/year_in_books/2018/19743140.

There are some books that need special mention.

Oathbringer

Oh my! I knew this would be good, and it was. From Kaladin’s fight with depression (In which I saw reflected some of my own struggles over the past decade) to the revelations of Dalinar’s past and of the history of the Radiants. Not to mention the declaration “I am Unity!” Absolutely spectacular.

The only downside is that my paperback copy is over 1200 pages and is too heavy to read comfortably. If there’s a split version as there was for the previous two books, I’ll probably buy them and donate the doorstop to the local library.

Starship’s Mage series

Imagine a world where technology has advanced to the point of kilometer-long starships and massive space stations, but where travel between the stars is only possible with magic. That’s the premise here, and it does make for a very interesting setting.

In the first book, he main character is a just-graduated jump mage looking for a ship to serve on. He finds a ship, and a lot more.

The Lions of Al-Rassan

I’ve been a fan of Guy Gavriel Kay for years, and this is another outstanding work from him. Set in a fantasy version of Spain, it follows characters from three different religions destined to clash and shows how the wars affect them and those around them.

Exquisitely written.

Redemption’s Blade

What happens after the Chosen One has defected the Dark Lord? How does a world torn apart by war settle back into its old ways?

A rant about presentations

My company’s internal conference is in a couple of weeks, so this seems like a good time to have a quick rant about some presentation failings I’ve seen over the last year or so.

If you want to, or are planning to present at a conference (or even just a usergroup), please, please, please pay attention to the following.

Don’t read your presentation

Please don’t read the bullets on your slides one by one. Please also don’t read a speech off your phone. If I wanted to have something read to me, I’d get an audio book.

A presentation should feel dynamic. It is, and should feel like, a live performance.

If you need reminders or cue cards, that’s fine, but put keywords on them, points that need to be discussed, not the entire speech

Watch your font size

This is for the slides but especially for the demos. Font size of 30 is probably the smallest you should be using on slides.

In demos, if I’m sitting in the back row and can’t read the code, there may be a problem. My eyes are not the best though, so that might be a failing on my part. If, however, I’m sitting in the second row and can’t read the code, there’s definitely a problem.

If the conference insists on, or offers time for a tech check, take the opportunity to check your fonts. A tech check isn’t just ‘does my laptop see the projector? Yes, done.’ Walk to the back of the room, go through all the slides, start your demo, walk back to the back of the room. Make sure that everything is clearly visible.

Minimalistic slides

Please don’t put an essay on your slide. Please don’t have fancy animation (unless you’re doing a presentation on animation). Don’t have things that flash, flicker, spin or dance.

It’s distracting, and it probably means your audience is watching your slides and not listening to you. You should be the star of the presentation, not your slides. They’re a support character.

Themes

I like the Visual Studio dark theme. It’s nice to code with, it’s absolutely terrible on a projector. Especially if the room is not dark. For projectors you want strong contrast. Dark font on light background usually works. Dark blue on black does not, two similar shades of blue doesn’t.

Check that your demos are visible, check that the code is readable from the back of the room.

Learn how to zoom in, whether with the windows built in tools or installed apps. Use the zoom any time that what you’re showing may not be clear.

Repeat the question

Especially if the session is being recorded. Your voice is being recorded, the audience isn’t. It is so frustrating to listen to a recorded session, hear a minute of silence followed by the presenter giving a single word answer.

Even if the session is not being recorded, acoustics often make it possible for the presenter to hear a question while part of the audience hasn’t.

It also gives you a chance to confirm that you heard the question correctly and gives you a few moments to think on an answer.

Memory Grant Feedback and data skew

The new adaptive query processing features in SQL Server 2017 are useful for fixing performance problems that were previously very hard to fix. They’re not perfect though, and one of the problems with memory grant feedback in particular is that it’s sensitive to data skew.

Before I get into why, let’s look at what adaptive memory grant does in the first place.

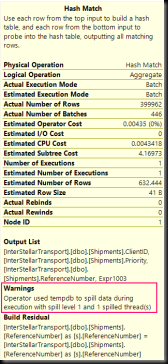
Queries request memory for operations like sorts, hash joins, hash aggregates and a few other operators. This is not TempDB space (ideally), it’s just memory. The amount requested is based on the optimiser’s guesses as to the size of the data that will be hashed/sorted, and that’s based off statistics and parameter values. Hence, there’s a chance for the guess to be wrong, and when it is, we get things like this:

PlanWithSpill

SpillDetails

When spill happen, the intermediate resultsets (or parts of them) do get written to TempDB. And read back. And potentially written and read back again, and maybe a few more times. This can be horribly slow.

Of course, there’s a chance that the estimate will be wrong in the other direction. Too large. It’s not as obviously bad, but it can limit the throughput of the system. Instead of the query running really slowly, it may have to wait before it runs at all, waiting for the memory to be granted. (RESOURCE_SEMAPHORE).

These were really hard problems to fix. There isn’t a query hint to request more or less memory than the estimates would allocate (though you can specify, as a percentage of the resource pool, the max and min memory to be allocated), so fixes had to be creative, typically tricking the optimiser into thinking there were more or fewer rows than there really were, or that the rows were wider (there are some lovely tricks that can be done with CROSS APPLY for example)

Adaptive memory grants don’t do anything to correct the optimiser’s mis-estimates. What they do, is allow the query processor to learn from the mistakes. If a query’s memory grant is significantly over or under what is needed, then a note is made of that, somewhere in memory, and the next time the query runs, the memory grant is adjusted to a value based on what the previous execution needed.

So, if we run the example from above a second time, making absolutely no changes in the process, the spills are gone.

SpillGone

This is great, unless you have a particular pattern in your workload, where one query will sometimes have a small number of rows flowing through it, and sometimes a large number. This is not a problem specific to Memory Grant Feedback. It’s been around for a long time, we call it bad parameter sniffing in many cases.

So let’s try a test of running the same query multiple times, alternating between parameter values that return small row counts and parameter values that return large row counts. The plan is the same in all cases, it’s a reused cached plan, and it’s one that’s not bad for the larger row counts (hash join, hash aggregate), so we don’t have the typical bad parameter sniffing problem, but the memory grant will oscillate, being based upon the previous query’s execution. I’m going to execute the stored procedure 200 times.

And I should mention that this is an extreme case. I specifically constructed a scenario where the memory grant required by one execution would be completely inappropriate for the next one. This is not (I hope) something that would happen in the real world.

I monitored what was happening with Extended Events, with the memory_grant_updated_by_feedback and memory_grant_feedback_loop_disabled events.

The results were kinda as expected.

image

And then something interesting happened. I didn’t clear the cache or anything, this was as the procedures executed in a loop.

image

After 8 executions, each with a memory grant update, both the execution count and the count of updates to the grant reset to 1.

This happened again 8 executions later

image

And again 8 executions later

image

Then, finally, after 32 executions, the update is disabled.

image

The procedure then went on to execute a further 168 times, with the same memory grant each time, equal to the last updated value.

So what can we conclude from this?

Firstly, there seems to be a re-evaluation of the memory grant feedback process every 8 modifications, deciding whether to continue adjusting. Second, it will stop adjusting memory grants at some point, though the conditions aren’t documented and I can’t tell from the test I ran what the conditions are. Since they’re not documented, they will probably change in future CUs/versions without notice.

Once the feedback cycle stops, the last memory grant value is what will be used for that query until its plan is removed from cache, at which point the adjustment cycle starts over from scratch.

If you’re working with a system that has this kind of query, with wide differences in optimal memory grant, I would suggest not relying on memory grant feedback, and changing the code so that the grant needed is more constant. This may require splitting procedures up, optimise hints or other fixes for bad parameter sniffing.

I suggest that because the feedback works great for ‘dialling in’ a good value for needed memory grant, but not for cases where the optimal grant is constantly changing. The 200 executions above took 4 minutes total without memory grant feedback, but 12 minutes with memory grant feedback.

It’s a great solution when the original estimate doesn’t match what the query needs, but it’s sub-optimal for queries with constantly changing memory needs. Procedures with widely changing memory needs should be fixed with other methods, including but not limited to multiple procedures, dynamic SQL, plan forcing, or other query hints.

When a forced plan isn’t forced

One of the uses for the Query Store, added in SQL 2016, is to force plans. Once forced, plans are supposed to remain unchanged, however there are cases where a forced plan will not be applied and a new plan will be generated.

Statistics changes, which are one of the things that usually cause recompiles, don’t disable a forced plan. It would be kinda weird if it did and against the point of a forced plan.

Schema changes are another matter.

Let’s look at a couple of cases.

First, schema changes that make the plan invalid, in other words, schema changes that affect something that the plan explicitly references. There aren’t that many schema changes that can make the plan invalid without making the query invalid as well, but there are a couple. Index changes, for example.

I want to test a few things:

  • An index change that won’t make the plan invalid (eg adding a column)
  • An index change that does make the plan invalid (eg removing a column that the query needs)
  • Renaming the index without changing its definition
  • Adding an index that would be better for the query than the one referenced by the forced plan.

First, the setup. My Interstellar Trading database with an extra index added:

CREATE INDEX idx_ForcingTest on Shipments (ClientID, HasHazardous, HasLiveStock, HasTemperatureControlled)

The query I’ll be running to test is

DECLARE @Storage TABLE (ID INT, Priority TINYINT, CountShipments INT);

INSERT INTO @Storage
SELECT OriginStationID, Priority, COUNT(*) FROM Shipments WHERE ClientID = 17 AND HasHazardous = 1
GROUP BY OriginStationID, Priority
GO

It’s inserting into a table variable to prevent any problems with the resultsets in SSMS.

I’ve been running the query for a while, and its plan is forced.

image

First test:

CREATE INDEX idx_ForcingTest ON Shipments (ClientID, HasHazardous, HasLiveStock, HasTemperatureControlled, ReferenceNumber)
WITH (DROP_EXISTING = ON)

image

No change. Forced plan is still forced.

Now, let’s make that index less useful, by removing a column that the query does need. There’s a key lookup in the plan, so there is a way for the column to be obtained, but it would change what columns come from each operator and where the filters are being done. Same plan shape, but different details.

CREATE INDEX idx_ForcingTest ON Shipments (ClientID)
WITH (DROP_EXISTING = ON)

image

We get a new plan. The forced one is invalid, because the index no longer allows for the seek predicates defined in the plan, and so the forcing is ignored and we get a new plan.

The query still runs without error, which is better than we’d have had using the old USE PLAN hint.

Once I revert the index back to its original definition, the forced plan starts being used again.

How about renaming the index? Since the plan references the index by name, this will probably also cause the plan forcing to fail.

And indeed it does.

image

One last test. I’m going to rename the index back to its old name, and then add a new one that’s better for the query than the index referenced in the forced plan.

image

And we’re still using the forced plan. The addition of a new index did not invalidate the existing plan, and hence the forced plan will still be used, even when there’s a better index.

This is the reason why I recommend using plan forcing only to fix stuff that’s broken in prod, and to find a solution without forced plans for the long term. It’s not always possible but where it is I’d prefer not to leave the plan forcing in place, because it does mean that new indexes are not considered. Plus, if the query store is ever cleared, the forced plan (along with the forcing) are gone.

Revisiting catch-all queries

I originally wrote about catch-all queries early in 2009, just as something that I’d seen several times in client code. It turned into the 3rd most popular post ever on my blog.

A lot’s changed since 2009. When I wrote the original post, most production servers were SQL 2005 or SQL 2000. SQL 2008 had been out less than a year and its fix for catch-all queries, the RECOMPILE hint, didn’t even work properly (it had an incorrect results bug in RTM, was pulled in SP1 and fixed in SP2)

As such, my feelings on how to solve the problem with catch-all queries has changed over the years.

Before I get to solutions, let’s start with the root cause of the problem with catch-all queries – plan caching and the need for plans to be safe for reuse.

Let’s take a sample query. I’ll use the same one I used in the original post.

CREATE PROCEDURE SearchHistory
(@Product int = NULL, @OrderID int = NULL, @TransactionType char(1) = NULL, @Qty int = NULL)
AS
SELECT ProductID, ReferenceOrderID, TransactionType, Quantity,
TransactionDate, ActualCost
FROM Production.TransactionHistory
WHERE (ProductID = @Product Or @Product IS NULL)
AND (ReferenceOrderID = @OrderID OR @OrderID Is NULL)
AND (TransactionType = @TransactionType OR @TransactionType Is NULL)
AND (Quantity = @Qty Or @Qty is null)
GO

There are two nonclustered indexes on the TransactionHistory table, one on ProductID, one on ReferenceOrderID and ReferenceLineID.

For the initial discussion, let’s just consider two of the clauses in the WHERE. I’ll leave the other two in the stored proc, but they won’t be used.

WHERE (ProductID = @Product Or @Product IS NULL)
AND (ReferenceOrderID = @OrderID OR @OrderID Is NULL)

We would expect, if the ProductID parameter is passed, to get a seek using the index on ProductID, if the ReferenceOrderID parameter is passed, to get a seek using the index on ReferenceOrderID, and if both are passed, then either an index intersection or a seek on one of the indexes, key lookup and secondary filter for the other, plus, in all cases, a key lookup to fetch the columns for the SELECT.

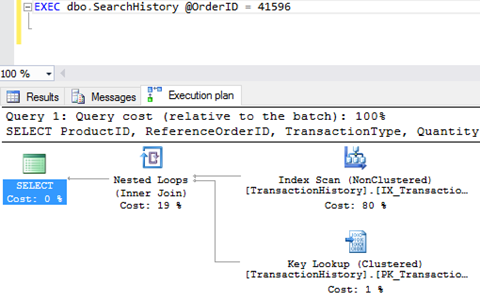
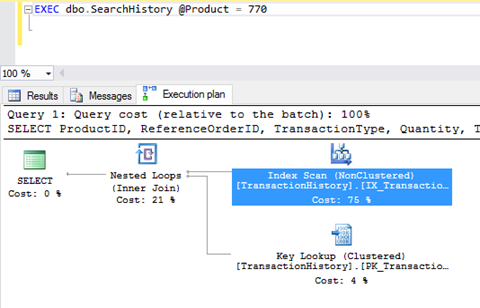
That’s not what we get (I cleared the plan cache before running each of these).
ProductScan

OrderScan

The expected indexes are used, but they’re used for scans not seeks. Why? Let’s just consider the second plan for a bit.

The index aren’t used for seeks, because plans must be safe for reuse. If a plan was generated with an index seek, seeking for ReferenceOrderID = @OrderID, and that plan was cached and reused later when @OrderID was NULL, we’d get incorrect results. ReferenceOrderID = NULL matches no records.

And so we have index scans with the full predicate (ReferenceOrderID = @OrderID OR @OrderID Is NULL) applied after the index is read.

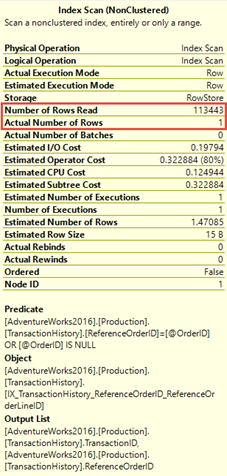
This is not particularly efficient, as the properties on the index seek shows.
InefficientIndexScan

The entire index, all 113443 rows were read, to return a single row. Not ideal, but it’s far from the largest problem with this form of query.

The plan’s got an index scan on the index on ReferenceOrderID, and then a key lookup back to the clustered index. That key lookup has a secondary filter on it, (ProductID = @Product Or @Product IS NULL). The optimiser assumed that a small number of rows would be returned from the index seek on ReferenceOrderID (1.47 to be specific), and hence the key lookup would be cheap, but that’s not going to be the case if the plan is reused with a ProductID passed to it instead of a ReferenceOrderID.

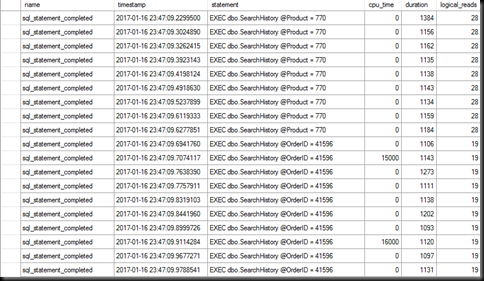
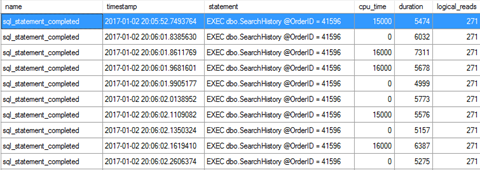
Before we look at that, the performance characteristics for the procedure being called with the ReferenceOrderID parameter are:
PerformanceOrder

The duration and CPU are both in microseconds, making this a very fast query, despite the index scan.

Now, without clearing the plan cache, I’m going to run the procedure with only the ProductID parameter passed.
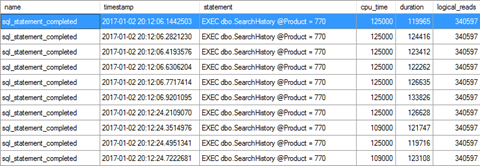
PerformanceProduct

CPU’s gone from an average of 8ms to around 120ms. Duration has gone from average around 6ms to about 125ms and reads have jumped from 271 (2 MB of data processed) to 340 597 (2.6 GB of data processed)

And this is for a table that has 113k records and a query that returned 4 rows.

The key lookup, which was fine when an OrderID was passed, is not fine when @OrderID is NULL and the index scan returns the entire table.
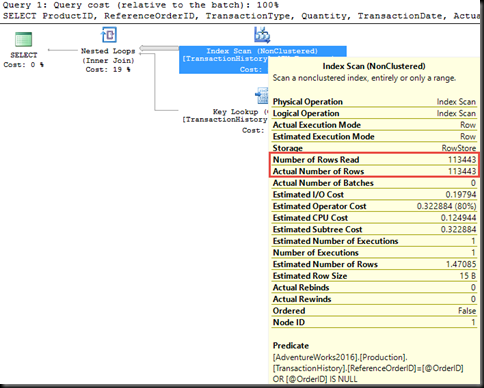
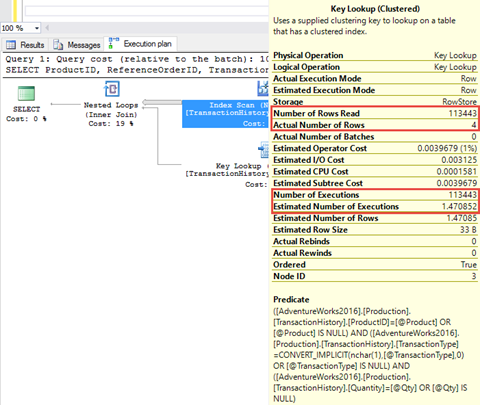
ExpensiveIndexScan

ExpensiveKeyLookup

The plans that the optimiser has come up with for this query form aren’t stable. They’re safe for reuse, they have to be, but performance-wise they’re not stable.

But, maybe it’s just this form of query, there are other ways to write queries with multiple optional parameters.

Let’s try the CASE and COALESCE forms.

CREATE PROCEDURE SearchHistory_Coalesce
(@Product int = NULL, @OrderID int = NULL, @TransactionType char(1) = NULL, @Qty int = NULL)
AS
SELECT ProductID, ReferenceOrderID, TransactionType, Quantity,
TransactionDate, ActualCost
FROM Production.TransactionHistory
WHERE ProductID = COALESCE(@Product, ProductID)
AND ReferenceOrderID = COALESCE(@OrderID, ReferenceOrderID)
AND TransactionType = COALESCE(@TransactionType, TransactionType)
AND Quantity = COALESCE(@Qty, Quantity)
GO

CREATE PROCEDURE SearchHistory_Case
(@Product int = NULL, @OrderID int = NULL, @TransactionType char(1) = NULL, @Qty int = NULL)
AS
SELECT ProductID, ReferenceOrderID, TransactionType, Quantity,
TransactionDate, ActualCost
FROM Production.TransactionHistory
WHERE ProductID = CASE WHEN @Product IS NULL THEN ProductID ELSE @Product END
AND ReferenceOrderID = CASE WHEN @OrderID IS NULL THEN ReferenceOrderID ELSE @OrderID END
AND TransactionType = CASE WHEN @TransactionType IS NULL THEN TransactionType ELSE @TransactionType END
AND Quantity = CASE WHEN @Qty IS NULL THEN Quantity ELSE @Qty END
GO
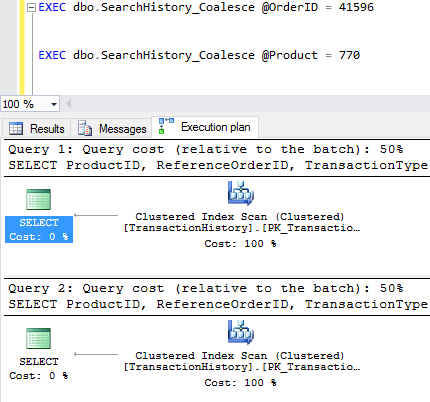
Coalesce

Case

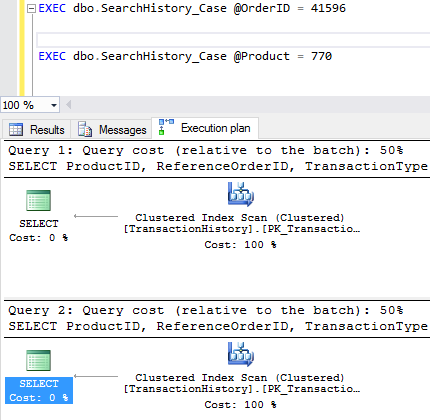
These both give us full table scans, rather than the index scan/key lookup we saw earlier. That means their performance will be predictable and consistent no matter what parameter values are used. Consistently bad, but at least consistent.

It’s also worth noting that neither of these will return correct results if there are NULL values in the columns used in the WHERE clause (because NULL != NULL). Thanks to Hugo Kornelis (b | t) for pointing this out.

And then two more forms that were mentioned in comments on the original post, slightly more complicated:

CREATE PROCEDURE SearchHistory_Case2
(@Product int = NULL, @OrderID int = NULL, @TransactionType char(1) = NULL, @Qty int = NULL)
AS
SELECT  ProductID,
ReferenceOrderID,
TransactionType,
Quantity,
TransactionDate,
ActualCost
FROM    Production.TransactionHistory
WHERE   (CASE WHEN @Product IS NULL THEN 1
WHEN @Product = ProductID THEN 1
ELSE 0
END) = 1
AND (CASE WHEN @OrderID IS NULL THEN 1
WHEN @OrderID = ReferenceOrderID THEN 1
ELSE 0
END) = 1
AND (CASE WHEN @TransactionType IS NULL THEN 1
WHEN @TransactionType = TransactionType THEN 1
ELSE 0
END) = 1
AND (CASE WHEN @Qty IS NULL THEN 1
WHEN @Qty = Quantity THEN 1
ELSE 0
END) = 1
GO

CREATE PROCEDURE SearchHistory_Complex
(@Product int = NULL, @OrderID int = NULL, @TransactionType char(1) = NULL, @Qty int = NULL)
AS
SELECT  ProductID,
ReferenceOrderID,
TransactionType,
Quantity,
TransactionDate,
ActualCost
FROM    Production.TransactionHistory
WHERE ((ProductID = @Product AND @Product IS NOT NULL) OR (@Product IS NULL))
AND ((ReferenceOrderID = @OrderID AND @OrderID IS NOT NULL) OR (@OrderID IS NULL))
AND ((TransactionType = @TransactionType AND @TransactionType IS NOT NULL) OR (@TransactionType IS NULL))
AND ((Quantity = @Qty AND @Qty IS NOT NULL) OR (@Qty IS NULL))

These two give the same execution plans as the first form we looked at, index scan and key lookup.

Performance-wise, we’re got two different categories of query. We’ve got some queries where the execution plan contains an index scan on one or other index on the table (depending on parameters passed) and a key lookup, and others where the execution plan contains a table scan (clustered index scan) no matter what parameters are passed.

But how do they perform? To test that, I’m going to start with an empty plan cache and run each query form 10 times with just the OrderID being passed and then 10 times with just the ProductID being passed, and aggregate the results.

Procedure Parameter CPU (ms) Duration (ms) Reads
SearchHistory OrderID 5.2 50 271
ProductID 123 173 340597
SearchHistory_Coalesce OrderID 7.8 43 805
ProductID 9.4 45 805
SearchHistory_Case OrderID 12.5 55 805
ProductID 7.8 60 804
SearchHistory_Case2 OrderID 10.5 48 272
ProductID 128 163 340597
SearchHistory_Complex OrderID 7.8 40 272
ProductID 127 173 340597


The query forms that had the clustered index scan in the plan have consistent performance. On large tables it will be consistently bad, it is a full table scan, but it will at least be consistent.

The query form that had the key lookup have erratic performance, no real surprise there, key lookups don’t scale well and looking up every single row in the table is going to hurt. And note that if I ran the queries in the reverse order on an empty plan cache, the queries with the ProductID passed would be fast and the queries with the OrderID would be slow.

So how do we fix this?

When I first wrote about this problem 7 years ago, I recommended using dynamic SQL and discussed the dynamic SQL solution in detail. The dynamic SQL solution still works very well, it’s not my preferred solution any longer however.

What is, is the RECOMPILE hint.

Yes, it does cause increased CPU usage due to the recompiles (and I know I’m likely to get called irresponsible and worse for recommending it), but in *most* cases that won’t be a huge problem. And if it is, use dynamic SQL.

I recommend considering the RECOMPILE hint first because it’s faster to implement and far easier to read. Dynamic SQL is harder to debug because of the lack of syntax highlighting and the increased complexity of the code. In the last 4 years, I’ve only had one case where I went for the dynamic SQL solution for a catch-all query, and that was on a server that was already high on CPU, with a query that ran many times a second.

From SQL 2008 SP2/SQL 2008 R2 onwards, the recompile hint relaxes the requirement that the generated plan be safe for reuse, since it’s never going to be reused. This firstly means that the plans generated for the queries can be the optimal forms, index seeks rather than index scans, and secondly will be optimal for the parameter values passed.
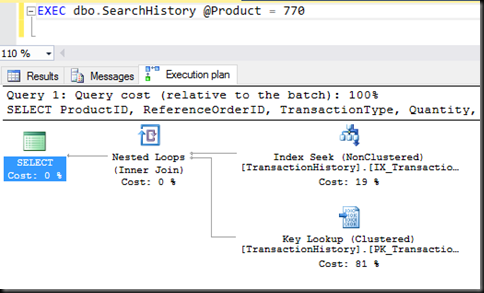
CatchallIndexSeek

And performance-wise?

RecompilePerformance

Reads down, duration down and CPU down even though we’re recompiling the plan on every execution (though this is quite a simple query, so we shouldn’t expect a lot of CPU to generate the plan).

How about the other forms, do they also improve with the RECOMPILE hint added? As I did before, I’m going to run each 10 times and aggregate the results, that after adding the RECOMPILE hint to each.

Procedure Parameter CPU (ms) Duration (ms) Reads
SearchHistory OrderID 0 1.3 28
ProductID 0 1.2 19
SearchHistory_Coalesce OrderID 6.2 1.2 28
ProductID 3.2 1.2 19
SearchHistory_Case OrderID 1.6 1.3 28
ProductID 0 1.2 19
SearchHistory_Case2 OrderID 7.8 15.6 232
ProductID 7.8 11.7 279
SearchHistory_Complex OrderID 1.5 1.4 28
ProductID 0 1.2 19


What can we conclude from that?

One thing we note is that the second form of case statement has a higher CPU, duration and reads than any other. If we look at the plan, it’s still running as an index scan/key lookup, despite the recompile hint.

The second thing is that the more complex forms perform much the same as the simpler forms, we don’t gain anything by adding more complex predicates to ‘guide’ the optimiser.

Third, the coalesce form might use slightly more CPU than the other forms, but I’d need to test a lot more to say that conclusively. The numbers we’ve got are small enough that there might well be measuring errors comparable to the number itself.

Hence, when this query form is needed, stick to the simpler forms of the query, avoid adding unnecessary predicates to ‘help’ the optimiser. Test the query with NULLs in the filtered columns, make sure it works as intended.

Consider the RECOMPILE hint first, over dynamic SQL, to make it perform well. If the query has long compile times or runs very frequently, then use dynamic SQL, but don’t automatically discount the recompile hint for fear of the overhead. In many cases it’s not that bad.
Homebuilt sequential columns

I gave my introductory session on transactions at all three of the South African SQL Saturdays in 2016, as well as at SQL Saturday Oregon in October 2017, and something that came up in most of them was the ‘manual sequence’, the idea of using a column in a table to store a max value and using that in place of an identity column or sequence object.

To be clear, I don’t think this is a good idea. The identity column works well if a sequential series of numbers are needed. If the number sequence needs to that spans tables, then the sequence object is a good replacement.
But, there will always be some requirements that insist on gap-less sequences, or insist on not using identity (probably for ‘compatibility’ reasons), so let’s see how to do it properly.

To start, the common attempt (taken from a random Stack Overflow answer)

DECLARE @next INT
SET @next = (SELECT (MAX(id) + 1) FROM Table1)

INSERT INTO Table1
VALUES (@next)

or, a slightly different form

DECLARE @next INT
SELECT @next = SequenceNumber + 1 FROM Table1

UPDATE Table1
SET SequenceNumber = @Next;

-- Then use @Next in another table for an insert

This doesn’t work. Oh, to be sure it’ll work in testing, but once we get some heavy concurrent access, its flaws become apparent.

To test the first one, I’m going to use a table that just has an ID (supposed to be unique) and a second column to record which session_id did the insert

CREATE TABLE TestSequence (
ManualID INT NOT NULL,
SessionID INT
)

And then run this 100 times from 10 different sessions

DECLARE @next INT
SET @next = (SELECT (MAX(ManualID) + 1) FROM TestSequence)

INSERT INTO TestSequence
VALUES (@next, @@SPID)

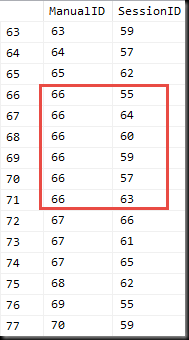
Duplicates

And it doesn’t work because the select statement takes a shared lock. Shared locks are shared, and so multiple sessions can read the same max value from the table, then write back that same value+1 to the table, either generating duplicate rows or primary key/unique constraint violations (hopefully the latter)

So how do we fix it?

One option is to wrap the two statement in a transaction and add the UPDLOCK hint to the select. This ensures that no one else will be able to read the same max value from the table, but depending on indexes it could also cause some blocking and resultant slow queries.

Another way is to make the insert (or update) and the select a single atomic operation, by returning the inserted (or updated) value from the insert (or update) statement. We can use the OUTPUT clause for this.

Option one would have code similar to this:

BEGIN TRANSACTION

DECLARE @next INT;
SET @next = (SELECT (MAX (ManualID) + 1) FROM TestSequence WITH (TABLOCKX, HOLDLOCK));

INSERT  INTO TestSequence
VALUES  (@next, @@SPID);

COMMIT TRANSACTION

And option 2 looks like

INSERT INTO TestSequence
OUTPUT inserted.ManualID
SELECT MAX(ManualID) + 1 FROM TestSequence WITH (TABLOCKX, HOLDLOCK)

The locking hints are, unfortunately, necessary. I tried several variations with less restrictive hints and they either:
– Produced duplicates
– Deadlocked when the table was small
– Deadlocked all the time

None of which are desired, hence the use of an exclusive table lock to serialise access. Of course, the restrictive locks will make this slow under concurrent usage. An index on ManualID will help, a bit.

Now we can test both of those the same way we tested the first version. An easy way to see whether there are any duplicates is to check the count and the distinct count.

DuplicateCheck

To reiterate something I said earlier, I do not recommend using this. Identity columns, with their gaps, are fine for the majority of cases, especially the use of them for artificial primary keys. Artificial keys, if used, are meaningless numbers that should not be exposed to users, and hence gaps should be irrelevant.

The need for a gap-less sequence, stored in the table, should be an exceptional one, not a common one.

Obsessing over query operator costs

A common problem when looking at execution plans is attributing too much meaning and value of the costs of operators.

The percentages shown for operators in query plans are based on costs generated by the query optimiser. They are not times, they are not CPU usage, they are not IO.

The bigger problem is that they can be completely incorrect.

Before digging into the why of incorrect percentages, let’s take a step back and look at why those costs exist.

The SQL query optimiser is a cost-based optimiser. It generates good plans by estimating costs for each query operator and then trying to minimise the total cost of the plan. These costs are based on estimated row counts and heuristics.

The costs we see in the query plan are these compilation time cost estimates. They’re compilation-time estimations, which means that they won’t change between one execution of a query using a particular plan and another query using the same plan, even if the parameter values are different, even if the row counts through the operators are different.

Since the estimations are partially based on those row counts, that means that any time the query runs with row counts different to what were estimated, the costs will be wrong.

Let’s look at a quick example of that.

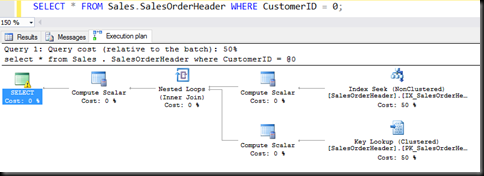
Cost1

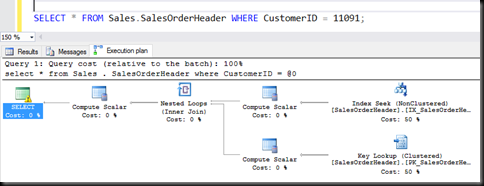
There are no customers with an ID of 0, so the plan is generated with an estimation of one row being returned by the index seek, and one row looked up to the clustered index. Those are the only two operators that do any real work in that plan, and each is estimated to read and fetch just one row, so each gets an estimation of 50% of the cost of the entire query (0.0033 it be specific)

Run the same query with a different parameter value, plans are reused and so the costs are the same.

Cost2

That parameter returns 28 rows, the index seek is probably much the same cost, because one row or 28 continuous rows aren’t that different in work needed. The key lookup is a different matter. It’s a single-row seek always, so to look up 28 rows it has to execute 28 times, and hence do 28 times the work. It’s definitely no longer 50% of the work of executing the query.

The costs still show 50%, because they were generated for the 0-row case and displayed here. They’re not run-time costs, they’re compile time, tied to the plan.

Another thing can make the cost estimations inaccurate, and that’s incorrect costing calculations by the optimiser. Scalar user-defined functions are the easiest example there.

CostsOff

The first query there, the one that’s apparently 15% of the cost of the batch, runs in 3.2 seconds. The second runs in 270 ms.

The optimiser gives scalar UDFs a very low cost (they have their own plans, with costs in them though) and so the costs for the rest of the query and batch are meaningless.

The costs in a plan may give some idea what’s going on, but they’re not always correct, and should not be obsessed over, especially not when the plan’s a simple one with only a couple of operators. After all, the cost percentages add to 100% (usually).