Author Archive: Gail

SQL Server 2016 features: Live query statistics

Ever wanted to look at a query’s actual execution plan (execution plan with runtime information) without waiting for the query to finish? Now you can.

LiveQueryStats

Enable that and run a query, and you get an execution plan immediately, one with a few more details in it than we’re used to.

LiveQuery

I’m not sure what the times on the operators show, because a constant scan wouldn’t take over 4 seconds, it generates a single number. I suspect it’s the time between the first row request and the operator returning ‘no more rows’, but I’d have to test more to be sure.

The percentage done is probably based on the estimated row count, because on this plan all the operators went to 99% done instantly. The two numbers underneath the % done are the number of rows currently processed and below that the estimated number of rows.

It’s clear there’s a severe row estimation problem here. The last nested loop join estimated 97 rows and, at the point the screenshot was taken, had processed 170500 rows. It’s a pity that the estimated executions isn’t shown as well, as it makes identifying row estimation errors slightly harder for operators that execute multiple times (eg the key lookup). https://www.sqlinthewild.co.za/index.php/2009/09/22/estimated-rows-actual-rows-and-execution-count/

Identifying this kind of problem is, I think, one of the primary uses for Live Query Stats (other that using it to see how the QP works). The old example of ‘it ran fast yesterday and slow today, why?’ can be at least partially answered with Live Query Stats. Run the query with it turned on and see what plan is used and what row counts are flowing through them. Combine that with Query Store’s history of what plans were used yesterday, and we have a very powerful way of identifying why something is running unusually slow.

However is it something that should be used sparsely in production, as it does add some  overhead.

LiveStatsOn

In most ways the Live Query Stats behaves like a normal execution plan, it can be saved and if saved part way through a query’s execution, the resultant file is a normal .sqlplan file and has actual row counts of the point in execution where it was saved.

It’s not a ground breaking new feature, but it’s a fun way to see how queries execute and it does have some uses in debugging sudden performance problems.

SQL Server 2016 features: Query Store

Given that SQL Server 2016 is coming ‘real soon now’, it’s probably well past time that I write up some thoughts on new features.

The first one I want to look at is a feature that I’m so looking forward to getting to use, the Query Store.

Query Store is essentially a flight recorder for a SQL database. It tracks queries, their execution characteristics and their execution plans. The best part is that this information is persisted into the database and hence is not lost on restart, as the current performance-related DMV contents are.

The data is aggregated over a defined period of time, by default an hour. This will probably be fine for most cases, if there are performance problems that come and go in fractions of an hour (like a case I had last year), then that interval may need to be reduced, depending on the type of problem.

There are lots and lots of blog posts on how to enable it and how to query it and the like, so I’m not going to repeat that info here. See http://sqlperformance.com/2015/02/sql-plan/the-sql-server-query-store for all of that kind of info.

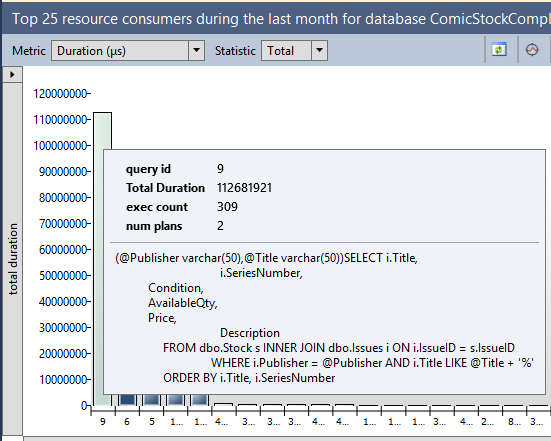
There’s two main aspects that I want to discuss about this feature. Let’s start with a screenshot of one of the Query Store’s built-in reports, the top resource-consuming queries.

QueryStore

The longest-running (on aggregate) query in this database is this nice parameterised query against the Stock and Issues tables. In the pane at the bottom of that report I can see its query plans.

Nothing really fancy there, except for one thing.

The server that I pulled those reports from has never had that query run against it. I pulled that report from an Azure VM that I set up last week. The workload all dates from 3 weeks ago.

Query Store data is persisted into the database, which means it’s included in a backup. I ran the workload against one server, backed up the database, restored it elsewhere and then queried the query store data. And there’s an even better part.

QueryStoreNoTables

Before running those Query Store reports, I dropped every table in the database.

Before this, to get the aggregated performance characteristics of a workload, I’d have to run a server-side trace or an extended events session, write the results out to a file, copy the file to my analysis server, load them into a table and aggregate the results. It’s a process that could take a day or two.

Now (or at least once SQL 2016 becomes widespread) I can just ask the client for their latest backup as all the query performance data I want is in there. If they’re uncomfortable with me having access to the data, they can restore the DB somewhere, drop all the tables then back up the ‘empty’ database and send me that. Much faster, and far fewer worries about having potentially missed something that ran at a time the trace wasn’t running.

The second thing isn’t so much about Query Store, as it is about the message that’s coming from Microsoft about it. Over and over and over they keep talking about how Query Store can be used to force a good query plan. It’s not hard to do.

Let’s take an example of a query with a parameter sniffing problem.

1
2
3
4
5
6
7
8
9
CREATE PROCEDURE GetOrders (@StartDate DATETIME)
AS
    SELECT  OrderDate,
            IssueID,
            QtyOrdered,
            Total
    FROM    Orders
    WHERE   OrderDate > @StartDate;
GO

The index on OrderDate isn’t covering, so a seek and key lookup is optimal for small numbers of rows and a clustered index scan is better for large numbers of rows

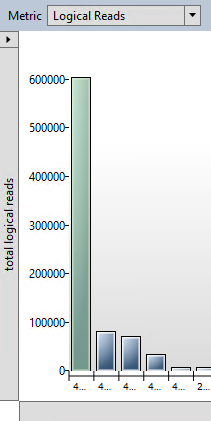
BadQueryLogicalReads

The query in question is by far the worst query in terms of logical reads on the server.

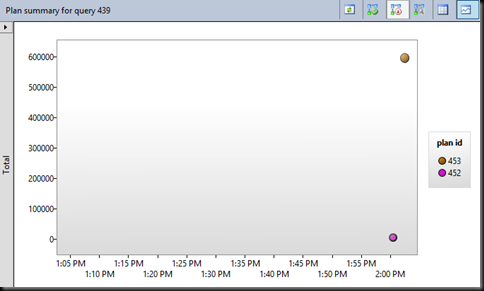
QueryStoreMultiplePlans

And it has two plans associated with it. The one at the top (plan 453) is the seek and key lookup. The one at the bottom (plan 452) is the clustered index scan.

Select the desired plan. It appears in the bottom section, then

ForcePlan

And problem solved.

Well…

I’d argue that’s less fixing the problem than hiding it. Sure, you won’t get a different plan, or at least that’s the idea. (While testing I did manage to get a different plan to the forced one, I need to investigate further why.) But is that forced plan the best solution? In this example, widening the index would have been a better solution. In other cases you might rather want to split the procedure into two, one for some date values one for others, or add the recompile hint, or even change the query.

Forcing a plan is great for stopping a problem that’s currently bringing production down, but it’s far from the only thing that will ever be done now. For starters forcing a good plan requires that there is a good plan, and if the query is written so it can’t use indexes or there are no suitable indexes, there won’t be a good plan to force. It’s a nice tool, but that’s all it is, another tool in the performance tuning box. It’s not a replacement for all other tuning work that’s ever been done

Now, I wonder how long it’s going to take to get my clients to upgrade.

Blocking operators and actual row counts

Query plans can sometimes be hard to read, and other times can be downright mystifying.

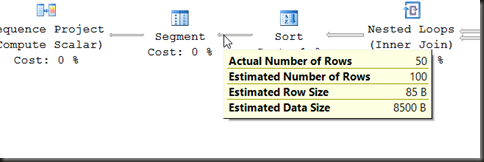
Take this plan for example. Not too hard in general. Two index seek/scan, a join, a sort and a filter. The peculiarity here is in the actual row counts. We expect that a join can filter rows out, that a filter can, well, filter rows out, that a top can reduce rows, that any aggregation can reduce the row count.

SortActualRowsBefore

SortActualRowsAfter

But why is a sort operator, a normal sort, reducing the row count? The answer lies in part not in how rows flow through the query plan, but in how control flows through the plan, and in part in the types of operators in the plan.

First let’s look at the types of operators. Here I don’t mean joins and aggregates and the like, I’m referring to whether an operator is a blocking operator or a non-blocking operator.

A non-blocking operator is one that consumes and produces rows at the same time. Nested loop joins are non-blocking operators.

A blocking operator is one that requires that all rows from the input have been consumed before a single row can be produced. Sorts are blocking operators.

Some operators can be somewhere between the two, requiring a group of rows to be consumed before an output row can be produced. Stream aggregates are an example here.

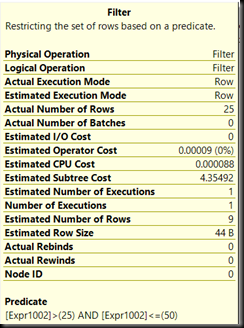
The sort in the plan is a blocking operator, and hence it needs all rows from the operator before it, the loop, before it can output any rows. That’s the 2920 going in to it, but why is there only 50 rows coming out?

That’s down to the way a query executes. Starting at the top of the plan, the top operator, in this case a SELECT asks the operator beneath it for a row. If the requested operator isn’t one that can generate a row (eg an index scan), then it asks the operator beneath it for a row.

The query that generated the shown plan had a filter based on the generated Row_Number of RowNumber between 26 and 50. This filter was executed by the Filter operator and partially by the Top operator.

RestOfPlan

FilterPropertiesTopProperties[3]

The TOP is there because the filter is on a Row_Number, the resultset is sorted by the columns defined in the Row_Number’s order by and there’s no partition by. The row numbered 50 will be the 50th row in the resultset and after that point there can be no more rows that satisfy the predicate. The query processor knows this.

So, the first row is requested by the select. The Filter can’t generate a row so it asks the Top for a row, and so on down the plan until we get to the sort.

The sort can’t request one row from the operator below it, it’s a blocking operator, it has to fetch all the rows from the operator below it. All 2920 of them.

Once the sort has all the rows, it sorts them and returns one row back to the previous operator. Repeat for the next row and the next.

Let’s fast-forward a few rows. The filter has just returned row 50 to the select operator. Select asks for the next row, row 51. The filter asks the top for the next row. The top, however, knows that it was only supposed to return the first 50 rows, and so instead it tells the filter operator that there are no more rows. The filter passes that up to the select and the query end there.

Hence why we have a sort further down the plan that only outputted 50 rows. Not because it filtered the rows itself, but because it was a blocking operator and the operators above it only asked for 50 rows.

It’s important to be able to read the execution plan in both directions. Reading the plan right-to-left is reading it in the direction of the data flow. Reading it left-to-right is reading it in the direction of the control flow. To fully understand plans it’s necessary to be able to do both.

Obsessing over query operator costs

A common problem when looking at execution plans is attributing too much meaning and value of the costs of operators.

The percentages shown for operators in query plans are based on costs generated by the query optimiser. They are not times, they are not CPU usage, they are not IO. The costs that the query optimiser generates are unit-less numbers that it uses internally to estimate the relative expense of plans as it optimises a query.

For starters, the percentages of operators should add to 100 across the entire plan, so worrying that the only data access operator in a simple query plan shows 100% is useless. If there’s only one index seek/scan in the plan, of course it’s going to be close to 100% of the total cost of the plan, there’s no where else for the cost to go.

But that’s not all. The accuracy of these estimates is based, in part, on the accuracy of the row estimations. If the statistics are out of date or there are any other row estimation errors, then the costs and as a result the percentages shown will be wildly incorrect

Take, for example, this query plan.

ExampleExecutionPlan

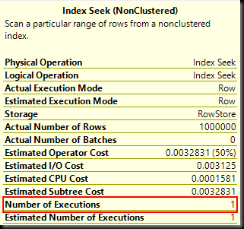
According to the percentages, the two operators were of equal cost. But a key lookup is just a single-row clustered index seek by a different name, and if we look at the number of executions of the two operators, it’s clear that they cannot possibly have been the same cost to execute

IndexSeek  KeyLookup

An index seek to return 1 million rows and a million index seeks to fetch one row each are not going to take the same amount of resources to execute, and hence those percentages are completely misleading.

Because the percentages can easily be way out, focusing on them when performance tuning is potentially going to result in a lot of wasted time. There is no single value, counter, measure or result that’s going to by itself indicate the cause of performance problems. Obsessing over single data points, or focusing on changing a single data point is almost certainly going to waste time.

Oh, and if anyone still wants to attribute importance to the percentages…

CostPercentages

Monitoring wait stats

This post, like last week’s, is based off the presentation I did to the DBA Fundamentals virtual chapter.

The request was for more details on the method I use to capture wait and file stats on servers, The methods are pretty similar, so I’ll show waits.

This is by no means the only way of doing it, it’s the way I do it.

Part the First: Capture job

This is the easy part. Into a job step goes the following:

1
2
3
4
5
6
7
8
9
INSERT  INTO Performance.dbo.WaitStats
SELECT  wait_type as WaitType,
        waiting_tasks_count AS NumberOfWaits,
        signal_wait_time_ms AS SignalWaitTime,
        wait_time_ms - signal_wait_time_ms AS ResourceWaitTime,
        GETDATE() AS SampleTime
FROM    sys.dm_os_wait_stats
WHERE   wait_time_ms > 0
    AND wait_type NOT IN (<list of waits to ignore>);

Schedule the job to run on an interval for a couple of days. I like to run it every 15 min, maybe every half an hour. I’m trying to get overall behaviour, not identify queries. If I need later to see what queries incur a particular wait, I can use an extended event session.

For the list of waits to ignore, I use Glenn’s list, the latest version found at http://www.sqlskills.com/blogs/glenn/sql-server-diagnostic-information-queries-detailed-day-14/

I run this no less than a day, preferably a week if I can. 2-3 days is normally what I get.

Part the Second: Analysis script

The analysis script does two things:

  • Get the wait times within an interval
  • Pivot them so that I can easily graph in excel

To see which waits I want to include in the pivot, I look at the 20 waits with the highest increase in the interval monitored (this requires that the server wasn’t restarted during it).

I’m not necessarily going to graph and analyse all of them, but it does help ensure I don’t miss something interesting (like, for example, high LCK_M_Sch_S locks every day between 08:00 and 08:45)

For the purposes of this post, let’s say the ones I’m interested in for a particular analysis are LCK_M_IX, PAGELATCH_EX, LATCH_EX and IO_COMPLETION.

To be clear, those are for this example only. Do Not copy the below code and run without specifying the waits you’re interested in looking at, or the results are going to be less than useless.

The first thing I want to do is add a Row_Number based on the times the wait stats were recorded, so that I can join and take the difference between one interval and the next. In theory it should be possible to do this with times, but the insert doesn’t occur at exactly the same time, to the millisecond, each interval, hence this would require fancy date manipulation. Easier to use a ROW_NUMBER

1
2
3
4
5
6
7
8
SELECT  WaitType,
        NumberOfWaits,
        SignalWaitTime,
        ResourceWaitTime,
        SampleTime,
        ROW_NUMBER() OVER (PARTITION BY WaitType ORDER BY SampleTime) AS Interval
FROM    dbo.WaitStats
WHERE   WaitType IN ('LCK_M_IX', ‘PAGELATCH_EX’, 'LATCH_EX', 'IO_COMPLETION');

Next step, turn that into a CTE, join the CTE to itself with an offset and take the difference of the waiting tasks, the signal wait time and the resource wait time.

01
02
03
04
05
06
07
08
09
10
11
12
13
14
15
16
17
18
WITH    RawWaits
          AS (SELECT    WaitType,
                        NumberOfWaits,
                        SignalWaitTime,
                        ResourceWaitTime,
                        SampleTime,
                        ROW_NUMBER() OVER (PARTITION BY WaitType ORDER BY SampleTime) AS Interval
              FROM      dbo.WaitStats
              WHERE     WaitType IN ('LCK_M_IX', ‘PAGELATCH_EX’, 'LATCH_EX', 'IO_COMPLETION')
             )
    SELECT  w1.SampleTime,
            w1.WaitType AS WaitType,
            w2.NumberOfWaits - w1.NumberOfWaits AS NumerOfWaitsInInterval,
            w2.ResourceWaitTime - w1.ResourceWaitTime AS WaitTimeInInterval,
            w2.SignalWaitTime - w1.SignalWaitTime AS SignalWaitTimeInInterval
    FROM    RawWaits w1
            LEFT OUTER JOIN RawWaits w2 ON w2.WaitType = w1.WaitType
                                           AND w2.Interval= w1.Interval + 1;

Last step, pivot the results. This will pivot and show the resource wait. Change the column that’s in the select and the pivot to show the others. It doesn’t matter what aggregation function is used because there’s only one value in each interval, so sum, avg, min and max will all give the same result (just, don’t use count)

01
02
03
04
05
06
07
08
09
10
11
12
13
14
15
16
17
18
19
20
21
22
23
24
WITH    RawWaits
          AS (SELECT    WaitType,
                        NumberOfWaits,
                        SignalWaitTime,
                        ResourceWaitTime,
                        SampleTime,
                        ROW_NUMBER() OVER (PARTITION BY WaitType ORDER BY SampleTime) AS Interval
              FROM      dbo.WaitStats
              WHERE     WaitType IN ('LCK_M_IX', 'PAGELATCH_EX', 'LATCH_EX', 'IO_COMPLETION')
             ),
        WaitIntervals
          AS (SELECT    w1.SampleTime,
                        w1.WaitType AS WaitType,
                        w2.NumberOfWaits - w1.NumberOfWaits AS NumerOfWaitsInInterval,
                        w2.ResourceWaitTime - w1.ResourceWaitTime AS WaitTimeInInterval,
                        w2.SignalWaitTime - w1.SignalWaitTime AS SignalWaitTimeInInterval
              FROM      RawWaits w1
                        LEFT OUTER JOIN RawWaits w2 ON w2.WaitType = w1.WaitType
                                                       AND w2.Interval = w1.Interval + 1
             )
    SELECT  *
    FROM    (SELECT SampleTime, WaitType, WaitTimeInInterval FROM WaitIntervals
            ) p PIVOT ( AVG(WaitTimeInInterval) FOR WaitType IN ([LCK_M_IX], [PAGELATCH_EX], [LATCH_EX], [IO_COMPLETION]) ) AS pvt
    ORDER BY SampleTime;

And there we have a result that can easily be imported into excel (or R) and graphed or analysed further.

Q&A from the DBA Fundamentals Virtual Chapter presentation

A couple weeks ago I presented to the DBA Fundamentals virtual chapter. The presentation was recorded and is available from their site.

While I answered some questions during the presentation, I couldn’t answer all of them. Hence this blog post with the rest of the questions and some answers.

Q1: Is monitoring any different in Azure SQL DB?

A1: Completely different. What I was talking about when the question was asked was perfmon counters and wait stats. Since you don’t have access to the server with the SQL DB, you can’t run perfmon. Even if you could, there’s unknown other workloads on the server which would make any such monitoring useless. Instead you can use the DMV sys.dm_db_resource_stats, which gives you the resource consumption relative to the maximum allowed for the tier that you’re paying for. For more details, see https://azure.microsoft.com/en-us/blog/azure-sql-database-introduces-new-near-real-time-performance-metrics/

The wait stats can be monitored with the DMV sys.dm_db_wait_stats, instead of sys.dm_os_wait_stats that you’d use on an earthed SQL Server. See https://msdn.microsoft.com/en-us/library/dn269834.aspx

Q2: What interval should we use for perfmon and how long should it be run?

A2: Personally I’m happy using the 15 second default in most cases. Perfmon has minimal overhead and the files aren’t large. If I’m trying to pin down an intermittent issue I’ll reduce the time, but I’ll very rarely increase it.

When analysing a server, I want minimum a day and that’s bare minimum. A week is good, that way I can see trends over several days and not be caught out by any non-standard workloads on one day.

Q3: Use performance monitor or sys.dm_os_performance_counters

Perfmon. Running a job every 15 seconds is hard and only the SQL counters are available through the DMV, so I’ll just use a performance monitor counter trace and save out as a binary file.

Q4: Is high CXPacket a problem?

By itself, all CXPacket waits mean is that queries are running in parallel. To determine whether that’s a problem or not requires looking at the queries that are running in parallel and seeing whether they should be, or whether they should be serial.

Most cases I’ve seen recently with very high CXPacket waits and very high Access_Methods_Dataset_Parent latch waits have been a result of inefficient queries and poor indexing, not a problem with parallelism itself.

http://sqlperformance.com/2015/06/sql-performance/knee-jerk-wait-statistics-cxpacket

Q5: What should average PLE be?

The higher the better. It measures how long, on average, a page stays in cache. Lower numbers mean more churn of the buffer pool. There’s no one number where above is good and below is bad.

http://sqlperformance.com/2014/10/sql-performance/knee-jerk-page-life-expectancy

and other pointless query rewrites

In a similar vein to last week’s blog post… I heard an interesting comment recently. “Change that Column != 2 to a Column > 2 or Column < 2 combination, it can use indexes better.”

Sounds like something that clearly needs testing!

I’ll start with simple numbers table.

1
2
3
4
5
6
CREATE TABLE dbo.Numbers (
  Number INT NOT NULL
);
 
ALTER TABLE Numbers ADD CONSTRAINT PK_Numbers
  PRIMARY KEY CLUSTERED (Number);

and put 1 million rows into it

1
2
3
INSERT INTO dbo.Numbers (Number)
SELECT TOP (1000000) ROW_NUMBER() OVER (ORDER BY (SELECT 1))
  FROM msdb.sys.columns c CROSS JOIN msdb.sys.columns c2;

Let’s start, before we get into comparing things, with looking at the execution plan of a query with a != (or <>) operator.

1
2
3
SELECT Number
  FROM Numbers
  WHERE Number <> 12742; -- because 2 is on the first page of the index, and I don’t want any special cases here

InequalityExecutionPlan

That’s kinda complicated for a query with one table and one predicate. Let’s look at in pieces. The easiest place to start is the Clustered Index Seek. The seek predicate on the clustered index seek is

Seek Keys[1]: Start: [Test].[dbo].[Numbers].Number > Scalar Operator([Expr1009]), End: [Test].[dbo].[Numbers].Number < Scalar Operator([Expr1010])

Hmm…Looks like the parser/optimiser has already made our intended change for us. There’s some funky stuff in the top part of the plan, but what it’s essentially doing is generating two rows for the nested loop join, both with just the value that we’re excluding from the query, then the seek runs twice. I suspect that’s once for the less than 12742 and once for the greater than 12742 portions of the original predicate.

But, let’s do the full due diligence, the plan may not tell the whole story.

The performance numbers for the inequality form of the query, gathered via Extended Events and aggregated with Excel are:

Duration 122ms
CPU 105ms
Logical reads: 1619

This is our baseline, the numbers we’re comparing against. If the comment mentioned at the beginning is correct, then the revised query will have a significantly better performance.

The revised query is:

1
2
3
SELECT Number
  FROM Numbers
  WHERE Number > 12742 OR Number < 12742;

Execution plan is much simpler, no constant scans, no joins. Just a single index seek operation that executes once.

InequalityRevised

Is is better though?

Duration: 126ms
CPU: 103ms
Logical reads: 1619

No, it’s not.

Yes, we have a simpler plan, but we do not have a more efficient query. We’re still reading every page in the index and fetching all but one row of the table. The work required is the same, the performance characteristics are the same.

But, maybe, if the numbers aren’t unique and we’re excluding more than just one row it’ll be different.

That needs a slightly different table to test on.

01
02
03
04
05
06
07
08
09
10
11
CREATE TABLE MoreNumbers (
SomeNumber INT NOT NULL,
Filler CHAR(100)
);
 
CREATE CLUSTERED INDEX idx_MoreNumbers ON dbo.MoreNumbers(SomeNumber);
GO
 
INSERT INTO dbo.MoreNumbers (SomeNumber, Filler)
SELECT TOP (500000) NTILE(50) OVER (ORDER BY (SELECT 1)), ''
FROM msdb.sys.columns c CROSS JOIN msdb.sys.columns c2;

I’m just going to look at the performance characteristics this time. The execution plans are the same as for the earlier query. The two queries are:

1
2
SELECT * FROM dbo.MoreNumbers WHERE SomeNumber != 24;
SELECT * FROM dbo.MoreNumbers WHERE SomeNumber < 24 OR SomeNumber > 24;

Query 1:

Duration 97ms
CPU 77ms
Logical Reads 7624

Query 2:

Duration 98ms
CPU 75ms
Logical Reads 7624

Again identical.

Just like with the pointless WHERE clause predicate last week, we have a query change that has had no effect on the query performance. Now, to be honest, there are some query form changes that can improve performance. For example, converting a set of OR predicates to UNION can improve query performance sometimes (and leave it unchanged in others), and so these kinds of rewrites do need to be tested to see if they’re useful.

More importantly though, those of us who are posting on forums and advising others have a responsibility to do these tests before we recommend changes to others, as they may very well not do them. If we don’t, we’re propagating myths and not helping the advancement of our field.

On the addition of useless where clauses

I remember a forum thread from a while back. The question was on how to get rid of the index scan that was in the query plan. Now that’s a poor question in the first place, as the scan might not be a problem, but it’s the first answer that really caught my attention.

Since the primary key is on an identity column, you can add a clause like ID > 0 to the query, then SQL will use an index seek.

Technically that’s correct. If the table has an identity column with the default properties (We’ll call it ID) and the clustered index is on that identity column, then a WHERE clause of the form WHERE ID > 0 AND <any other predicates on that table> can indeed execute with a clustered index seek (although it’s in no way guaranteed to do so). But is it a useful thing to do?

Time for a made up table and a test query.

1
2
3
4
5
6
7
CREATE TABLE dbo.Orders(
  OrderID INT IDENTITY(1,1) NOT NULL PRIMARY KEY,
  OrderDate DATETIME2(7) NULL,
  ShipmentRef CHAR(10) NULL,
  ShipmentDate DATE NULL,
  Status VARCHAR(20) NOT NULL
);

That’ll do the job. And then a few hundred thousand rows via SQL Data Generator and we’re good to go.

And for a query that has a nasty index scan, how about

1
2
3
4
5
SELECT  OrderDate,
    ShipmentDate,
    Status
  FROM    dbo.Orders
  WHERE   LTRIM(RTRIM(Status)) = 'Delivered';

ClusteredIndexScan

Now, that’s running as a clustered index scan because the predicate’s not SARGable and besides, there’s no index on that column, but let’s pretend we don’t know that.

If I add a WHERE clause predicate that filters no row out, can I get a query plan with an index seek?

1
2
3
4
5
6
SELECT  OrderDate,
    ShipmentDate,
    Status
  FROM    dbo.Orders
  WHERE   LTRIM(RTRIM(Status)) = 'Delivered'
    AND OrderID > 0;

Why yes, I can.

ClusteredIndexSeek

Op Success? Well…

The goal of performance tuning is to improve the performance of a query, not to change operators in a query plan. The plan is a tool, not a goal.

Have we, by adding a WHERE clause predicate that filters out no rows, improved performance of the query? This needs an extended events session to answer. Nothing fancy, just a sql_statement_completed event will do the trick.

I ran each query 10 times, copied the captured events into Excel and averaged them:

Query with just the LTRIM(RTRIM(Status)) = ‘Delivered’
CPU: 77ms
Duration: 543ms

Query with LTRIM(RTRIM(Status)) = ‘Delivered’ AND OrderID > 0
CPU: 80ms
Duration: 550ms

We haven’t tuned that query. I won’t say we’ve made it slower either, the differences are well within the error range on our measuring, but there’s definitely no meaningful performance gain.

There’s no gain because we haven’t changed how the query executes. A scan, and in this case it will be a scan of the entire index, will likely use the non-leaf levels of the b-tree to locate the logical first page of the leaf level, then will read the entire leaf level. The seek we managed to generate will use the b-tree to find the value 0 in the clustered index key, that’s what makes it a seek. Since the column is an identity starting at 1, that means the first row read will be on the logical first page of the leaf level, then it will read the entire leaf level.

Both will do the same amount of work, and so we haven’t done anything useful to the query by adding a WHERE clause that filters out no rows.

Scans are not always bad. If a query needs to read every row of a table, that’s a scan and effort shouldn’t be expended trying to make it an index seek.

To improve the performance of a query, we need to make changes that reduce the work needed to run the query. That often starts with reducing the amount of data that the query reads, by changing the query so that it can use indexes effectively and/or adding indexes to support the query. Not by adding pointless pieces to a query just to change plan operators from ones that are believed to be bad to ones that are believed to be good. Doing that is just a waste of time and effort.

Does an index scan always read the entire index?

No.

That’s a bit short for a blog post, so let me explain. First, the difference between a seek and a scan.

A seek is an operation which navigates down the index’s b-tree looking for a row or for the start/end of a range of rows. A seek requires a predicate and that predicate must be of the form that can be used as a search argument (SARGable).

A scan is a read of the leaf level of an index, possibly also reading the intermediate pages as well.

The key there is that a seek requires a predicate. If there’s no predicate, we cannot have a seek and hence must have a scan.

Let’s look at a couple of examples. I’m going to use a simple Numbers table as it’s perfectly adequate for what we’re doing here.

1
2
3
4
5
6
7
CREATE TABLE Numbers (
  Number INT NOT NULL PRIMARY KEY CLUSTERED
);
 
INSERT INTO Numbers (Number)
SELECT TOP (1000000) ROW_NUMBER() OVER (ORDER BY (SELECT 1))
  FROM msdb.sys.columns c1 CROSS JOIN msdb.sys.columns c2;

With the table created, I want to look at how many pages that clustered index has. It won’t be a huge number, the table is very small.

1
2
SELECT OBJECT_NAME(object_id) AS TableName, index_level, page_count, record_count, avg_record_size_in_bytes
  FROM sys.dm_db_index_physical_stats(DB_ID(), OBJECT_ID('Numbers'),1,NULL, 'Detailed');

IndexPages

Three level deep clustered index, 1608 pages at the leaf and a total of 1614 pages in all levels.

Let’s start with something basic:

1
2
3
4
SET STATISTICS IO ON;
GO
 
SELECT * FROM Numbers;

FullTableScan

Table ‘Numbers’. Scan count 1, logical reads 1615, physical reads 0

That read the entire index, every page at every level. The extra page was likely the IAM page for that index. That’s kinda what we expect a scan to be.

For contrast, let’s try an obvious seek.

1
SELECT * FROM Numbers WHERE Number = 137;

Seek

Table ‘Numbers’. Scan count 0, logical reads 3, physical reads 0.

A single-row seek operation does three reads, which makes sense since we have a three-level deep clustered index.

Now, what about this?

1
SELECT TOP (1) * FROM Numbers;

It can’t be a seek operation, there’s no predicate. The only way this can be implemented is with a scan.

Top1Scan

It is indeed a scan, but did it read the entire table?

Table ‘Numbers’. Scan count 1, logical reads 3, physical reads 0.

No. A scan of the entire index is over 1600 pages. This query read three. It’s a scan, but it’s a scan which stopped after reading one page of the leaf (the other two are likely the root and intermediate pages, used to locate the first page in the leaf).

The scan read one row and then stopped, because that’s all that was needed. It did that, because there was a 1 row row-goal added to the query. For more details on row goals, see Paul White’s article on the subject.

There’s other cases where a scan won’t read the entire index leaf level too.

Aggregations, well MIN and MAX of an indexed column:

1
SELECT MIN(Number) FROM Numbers;

IndexScanMin

Table ‘Numbers’. Scan count 1, logical reads 3, physical reads 0.

EXISTS:

1
2
IF EXISTS(SELECT 1 FROM Numbers)
SELECT 1;

ExistsScan

Table ‘Numbers’. Scan count 1, logical reads 3, physical reads 0.

In conclusion, a seek operation requires a predicate. Without a predicate, a query has to be evaluated with a scan, but a scan doesn’t always mean that the entire table is read.

Stop using Task Manager to check SQL’s memory usage!

There’s two fairly common questions I see on the forums around SQL Server’s memory usage. Either the question asks why SQL’s using too much memory, or why it’s using too little.

Too much memory isn’t usually a real problem, it’s often due to max server memory being left at its default of 2048TB, along with a lack of understanding of how SQL uses memory.

Too little memory used is also often not a real problem, rather it’s usually from using the wrong tools to check SQL Server’s memory usage.

Let’s start by looking at an example.

This particular server has 16 GB of memory, and SQL Server’s max server memory is set to 10GB. Since the last restart of the instance, I’ve run SELECT * FROM .. against every table in a 30GB database. That should have warmed the cache up nicely.

MemoryTaskManager

Err, what? SQL Server’s not even using 100MB? I’ve just read 30GB of data and SQL Server’s not even using 1% of it’s allowed memory!!!

Or is it?

TotalServerMemory

A look at perfmon shows a completely different picture. Total and target server memory are both at 10GB. So why is Task Manager showing such a low figure?

LockedPagesInErrorLog

The service account that SQL’s running under has been granted the Lock Pages in Memory permission. This means that SQL’s not using the normal Windows memory routines to allocate memory.

Normally, SQL Server and other Windows applications allocate memory using the VirtualAlloc API call. This allocates virtual memory which is pageable. When SQL Server has been given the Lock Pages in Memory permission, it doesn’t use VirtualAlloc to allocate memory. Instead it uses the API call AllocateUserPhysicalPages. Memory allocated with this API call is not pageable, it has to remain in physical memory.

Task Manager’s memory counters (the Working Set ones) only show memory that’s been allocated using VirtualAlloc. Hence, when SQL Server has the Lock Pages in Memory permission and is allocating most of its memory using AllocateUserPhysicalPages, its memory usage in Task Manager will appear to be extraordinarily low. As far as I recall, in that case it’s only the non-buffer memory which is still allocated with VirtualAlloc, and that’s just things like the thread stacks, the CLR memory, backup buffers, and similar. It’s not the buffer pool. The buffer pool gets allocated with AllocateUserPhysicalPages.

If I remove the Lock Pages in Memory and re-run the test, Task Manager shows completely different values

MemoryTaskManager_NoLockedPages

Now the buffer pool is being allocated with VirtualAlloc and so Task Manager shows the full 10GB of memory usage.

In summary, Task Manager can show a completely incorrect value for SQL Server’s memory usage if the SQL service account has the Lock Pages in Memory permission. This can lead to a lot of wasted time if it is concluded that Task Manager is correct and SQL Server is using little memory.

Rather leave Task Manager alone and use perfmon and the DMVs to check what SQL Server’s memory allocation actually is. They’ll both be correct whether Lock Pages are being used or not.