Hunting for the True Location, with Machine Learning
Some context first.
My company puts on a year end function every year. It’s at some resort or other, and the important thing for this post is that we’re not told the location in advance. We find out when we get there (by bus).
What we are told, about a month ahead of the event, is approximate distances from 3-4 locations. These are where the bus pickup sites are. The locations are:
- Head Office
- Near Clearwater Mall
- Fourways
- Centurion
The distances given aren’t correct. And, as a result, there’s usually several attempts by various people to figure out where the year end function will be in advance.
I thought I’d join in this year, using some machine learning on those distances.
Now, I should mention that this is a very poor use for ML. Mainly because of a lack of data. I should have hundreds of data points for a decent prediction. I have 2 or 3 data points, for 4 different locations. Still, it’s what I have to work with.
First, the starting data. The distances for this year are:
- Clearwater mall: 63 KM
- Centurion: 56 KM
- Fourways: 43 KM
- HQ: 20 KM
- Cape Town: 1447 KM
I’m going to ignore Cape Town for training, as it only had a distance previously specified in 2015, and so I only have one piece of data.
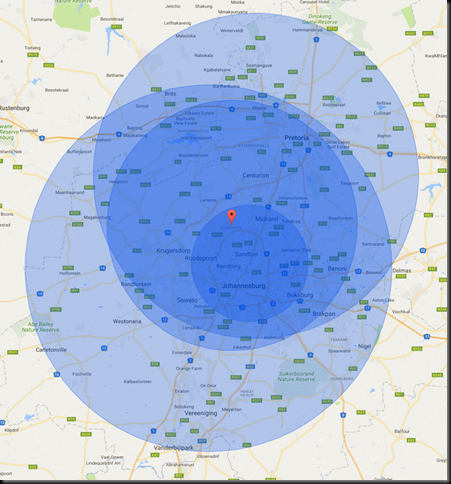
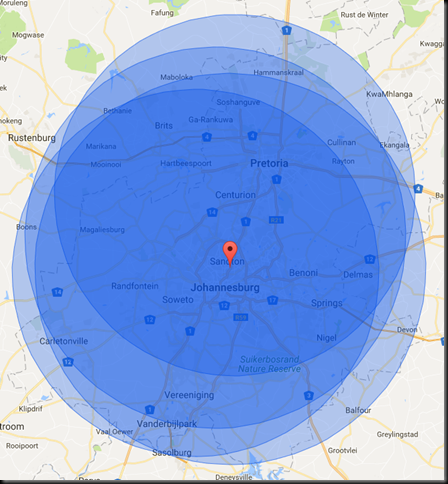
Plotting this on a map makes it clear that the distances have been ‘massaged’ (I’m plotting ‘as the bird flies’, not driving distance for ease of plotting, I’ll use driving distances for the training)
Let’s look at previous years.
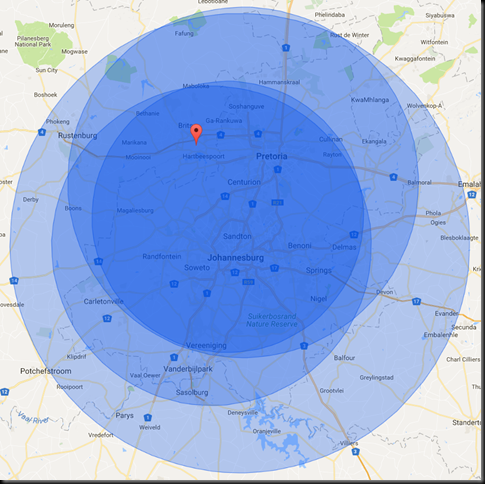
2016
Actual location: Seasons Sport and Spa (pin on the map below)
Actual distances calculated with Google Maps, driving distance, shortest route.
- Clearwater: Given distance – 80KM. Actual distance – 67KM
- Centurion : Given distance – 88KM. Actual distance – 47KM
- Fourways : Given distance – 68KM. Actual distance – 52KM
- HQ: Given distance – 115KM. Actual distance – 75KM
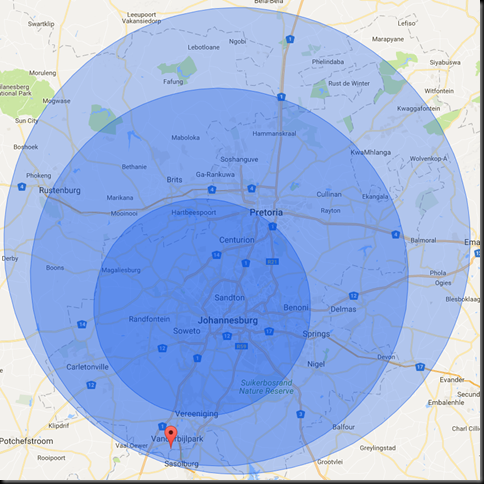
2015
Actual location: Vaal River Country Lodge.
Actual distances calculated with Google Maps, driving distance, shortest route.
- Clearwater Mall: Given distance – 51KM. Actual distance – 79KM
- Centurion: Given distance – 110KM. Actual distance – 118KM
- Fourways: Given distance – 89KM. Actual distance – 97KM
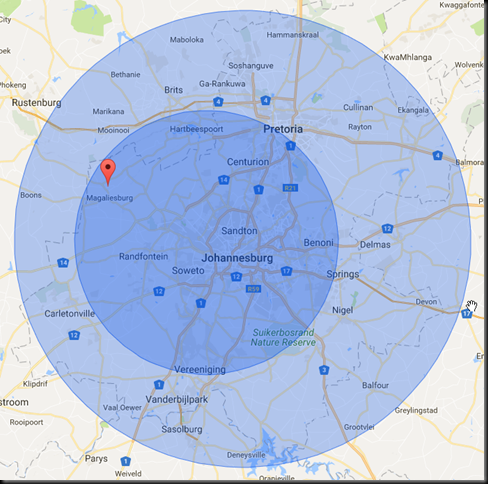
2014
Actual location: Askari Game Lodge.
Actual distances calculated with Google Maps, driving distance, shortest route.
- Clearwater Mall: Given distance – 52KM. Actual distance – 79KM
- HQ: Given distance – 90KM. Actual distance – 118KM
With that, I have the following training data:
| Location | Given Distance | Error in Distance (Given – Actual) |
| Clearwater Mall | 80 | 13 |
| Clearwater Mall | 51 | -28 |
| Clearwater Mall | 52 | -27 |
| Centurion | 88 | 41 |
| Centurion | 110 | -8 |
| Fourways | 68 | -6 |
| Fourways | 89 | -8 |
| HQ | 115 | 40 |
| HQ | 90 | -28 |
Now to stick those into a linear regression and see if I can predict the error on this year’s measurements.
I need to mention that with so little data, the accuracy of the linear regression is going to be very low. I’m as likely to get the correct results from linear regression as I am to get correct results from rolling a couple of d20s.
That said, onwards to untrustworthy results.
Once the starting values are loaded into R, creating a simple model is as easy as
m <- lm(Error ~ Location + Distance, data=YEF)
Then load up this year’s values into another data frame, and predict.
predict(m, YEFPredict)
The errors come out as:
- Clearwater Mall: -12
- Centurion: -18
- Fourways: -35
- HQ: -60
Giving final estimated distances (Given – Error) as
- Clearwater Mall: 75KM
- Centurion: 74KM
- Fourways: 78KM
- HQ: 80KM
Maybe I should have stuck to using dice.
