SQL Server

All you need to know about Columnstore Indexes in one article

I realised the other week, that despite a bunch of posts on indexes over the years, I’ve never written a blog post on Columnstore indexes. Time to fix that. Here’s everything you need to know to get started using columnstore indexes. (Note, this is not, in any way, everything there is to know about columnstore indexes, for that see Nico’s blog series, currently at 131 entries long)

Before I dive into columnstores, for comparison let me first discuss rowstore indexes.

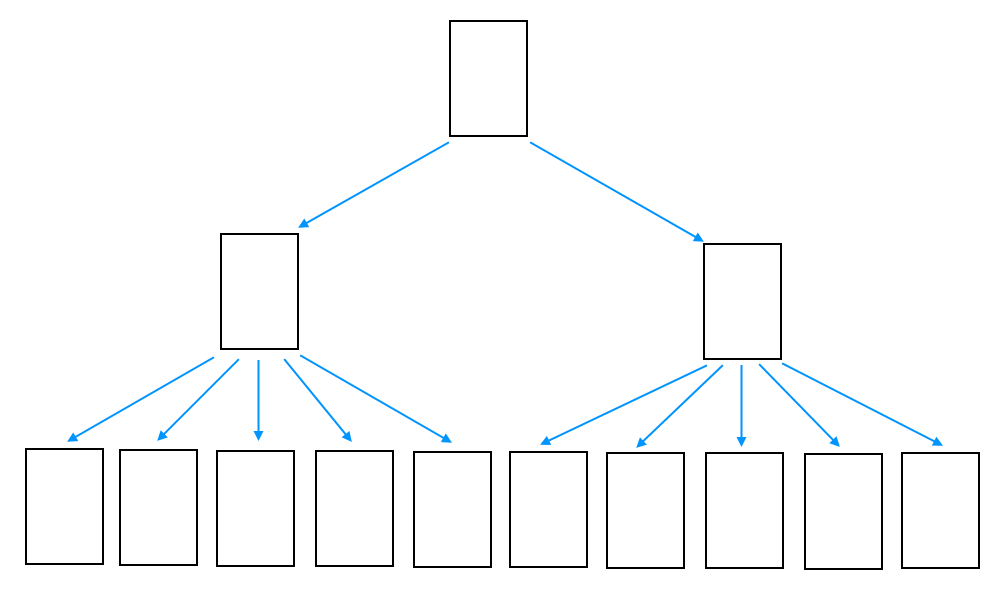
In a rowstore index (what we previously would have just called an index), pages are in a b-tree, the leaf levels containing all the rows and the upper levels containing one row per page below them.
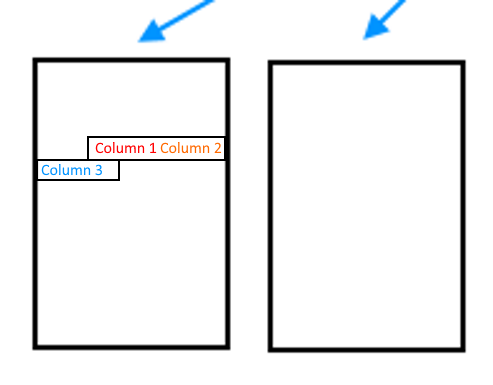
The columns that make up the row (or at least those which are part of the index) are found together in the page. Hence, wanting one column from the index means reading the entire page and all of the other columns that are part of that index.
Columnstores are… different.

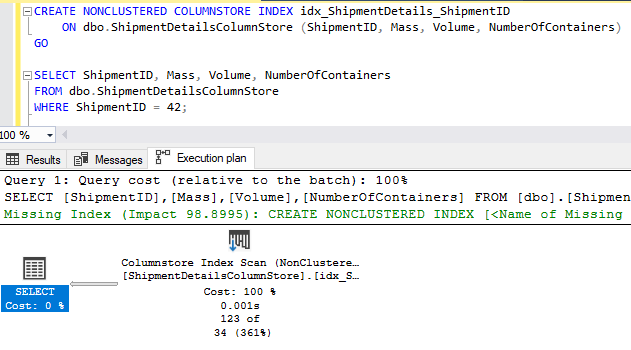
The first, and I would say most important thing to realise about columnstore indexes is that they don’t have keys. These are not seekable indexes. Any access to a columnstore index is going to be a scan.
Instead of storing the rows together on a page, a columnstore index instead stores column values together. The rows in the table are divided into chunks of max a million rows, called a row group, and the columns are then stored separately, in what are called segments. A segment will only ever contain one column’s values.
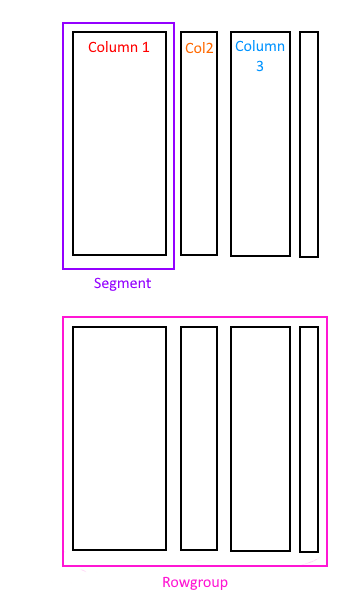
The segments are then compressed, and because typically there will be repeated values in a column, they can compress quite well.

Because of this architecture, if a query needs to get all the values for Column 2 and Column 3, it’s a very efficient access. All of the segments that contain Column 2 and Column 3 can be read, and the segments that contain the other columns can be completely ignored. Conversely, if the query needs all of the columns for a handful of rows, it’s quite an inefficient access. Because there’s no way to seek against a columnstore index, all of the segments would have to be read* to locate the column values that make up the row and the row would have to be reconstructed.

(*) There is a process called rowgroup elimination which can remove row groups from consideration when locating rows. I will not be going into that in this article.

An index of this form is not editable, not easily anyway. The columns are all compressed, so changing a single value could require the entire segment be decompressed before updating a value. The first version of columnstore indexes were indeed readonly, but that made them less than useful in many cases, and so since SQL 2014 columnstore indexes are updatable. Kinda

Well, the compressed segments are not updatable, nor can they be added to, nor can they be deleted from. Directly, that is. Instead what’s done is that new rows are added to something called a ‘delta store’, which is a b-tree index associated with the columnstore. Newly inserted rows are added to this delta store, not to the compressed segments directly. Once the delta store reaches a certain size it’s closed, compressed and the contents are a added to the columnstore index as a new rowgroup. Deletes are handled similarly. When a row is deleted, a flag is set in a deleted bitmap indicating that the row is no longer present. When the index is read, any rows marked deleted in the bitmap are removed from the resultset. Updates are split into deletes and inserts, and hence flag the old version of the row as deleted and then insert the new version of the row into the delta store.

Index rebuild will recreate all of the rowgroups and remove the logically deleted rows, as well as force any open rowgroups to be compressed. Index reorganise operations will force open rowgroups to be compressed and will remove logically deleted rows if more than 10% of the rows in a rowgroup are flagged deleted.

All well and good so far, but why bother? The simple answer here is speed. Columnstore indexes are fast for operations involving large numbers of rows for a couple reasons

  • Column-based storage
  • Compression
  • Batch mode query processing

The first one we’ve already looked at. When a query needs most of the rows in the table but only a few of the columns, the column-based storage is more efficient.

Compression is the second reason. Columnstore indexes are compressed, and because there’s more compression opportunities for column values stored together than rows, they typically compress very well. Good compression means less data which needs to be moved around, which generally translates to better performance

Batch mode used to be the third reason. Batch mode is a query processor feature where multiple rows can be processed at once, rather than one row at a time. It can be a lot faster than row mode. When columnstores were introduced, batch mode was only an option when there was a columnstore index used in the query, but since SQL 2017 batch mode has been available for rowstore indexes as well.

How much faster? Well…
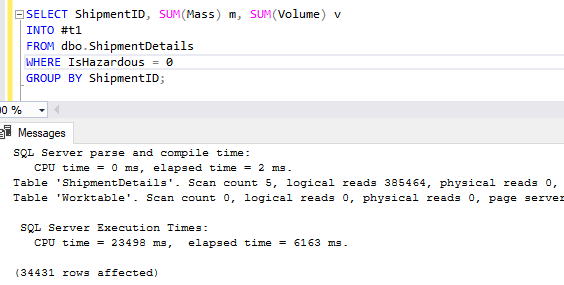
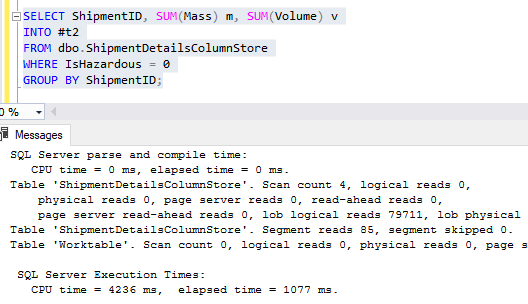
The only difference between the above two queries is that one ran against a table with a rowstore clustered index and one ran against a table with a columnstore clustered index. Oh, and 19 seconds of CPU time. Both tables have exactly the same data in them, 88 million rows.

That’s about all for a high-level overview of columnstore indexes. Of course this isn’t everything there is to know about columnstores, just what you need to know to get started using them. If you want everything, there’s always Nico’s blog series.
Trust, but verify

Every year my company runs a graduate bootcamp, 2 months of teaching new grads what they need to know to write production-ready software. This post was inspired by something that happened during this year’s bootcamp.

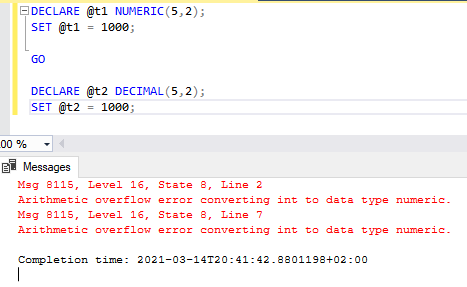
One afternoon I noticed a post in the chat channel recommending using DECIMAL over NUMERIC because “the scale in the declaration for the numeric is the exact scale, but for decimal it’s the minimum scale.” Essentially saying that NUMERIC(5,2) cannot store 1000, but DECIMAL(5,2) can. There was a link to a blog that explained that in more details. Sounds good, but there’s one problem…

Decimal vs Numeric

And a quick check of the Microsoft documentation states that DECIMAL is a synonym of NUMERIC (and the error messages imply the same)

Now, I’m not going to link to that blog, because a careful reading of the blog shows it to be correct in that statement, but the blog is talking about ANSI-standard SQL, not the T-SQL variant that SQL Server uses.

This is a very easy mistake to make, to misread what version of a product a blog post refers to, to misread what product a blog post refers to. And that’s ignoring the very real possibility that the blog post might be incorrect.

Trust what you read on people’s blogs but verify it (yes, including mine). Test out the assertions if you can, run example code, check against other blogs, check against the documentation. Just don’t assume that everything you read is correct and applies to the situation you are it. It won’t be.

What is deferred compilation?

When I talked about row estimations for table variables, I mentioned ‘deferred compile’, but didn’t give a whole lot of details. What, then, is a deferred compilation? Let’s start with how batches work normally.

T-SQL is an interpreted language. While we talk about compiles, they’re not compilations in the sense of what happens to C++. There’s no conversion of the script to a machine language or intermediate language which is used from that point onwards. Every time a batch executes, it has to be parsed, bound and have an execution plan generated or fetched from cache.

When a batch is parsed, the entire batch is parsed.

SET STATISTICS TIME ON
GO

SELECT * FROM dbo.Clients

SELECT * FROM dbo.StarSystems ss 
INNER JOIN dbo.Stations s ON s.StarSystemID = ss.StarSystemID

SELECT GETDATE()
GO

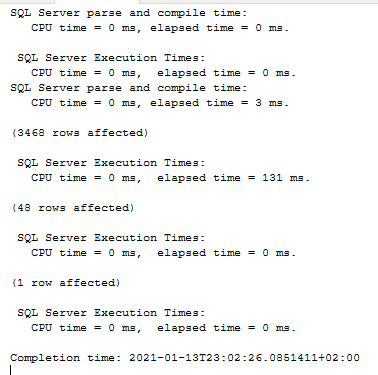
Ignoring the SET STATISTICS, we’ve got there one batch with two queries in it. Two queries, two execution times but only one parse and compile time. The entire batch was compiled and then the batch was executed.

If we set up an XE session to track compiles, it shows similar

The XE session shows that the compilations for both queries were completed before either started execution.

But what happens if we reference a table that doesn’t exist?

SET STATISTICS TIME ON
GO

SELECT * FROM dbo.Clients

SELECT * FROM dbo.StarSystems_DoesNotExist ss 
INNER JOIN dbo.Stations s ON s.StarSystemID = ss.StarSystemID

SELECT GETDATE()
GO

The first of the queries is still compiled, but not the second. The second can’t be compiled because it references an object that doesn’t exist. The first query then executes, and right before when the second query would execute, it’s sent back to be bound and optimised. In this case, the object still doesn’t exist and so we get an error.

Msg 208, Level 16, State 1, Line 6
Invalid object name 'dbo.StarSystems_DoesNotExist'
.

But if the object was created between the start of the batch and the query that uses it, we get a still different result

SET STATISTICS TIME ON
GO

SELECT * FROM dbo.Clients

SELECT * INTO #StarSystems FROM dbo.StarSystems

SELECT * FROM #StarSystems ss 
INNER JOIN dbo.Stations s ON s.StarSystemID = ss.StarSystemID

SELECT GETDATE()
GO

This time we have three queries. Two of them get an execution plan generated when the batch starts, but the third can’t, because the table it references doesn’t exist. Instead, the statement starts executing but can’t execute because there’s no plan. It gets sent back to the optimiser to be compiled, then the query executes.

This is a deferred compile (also called deferred resolution). A compile that does not happen when the batch starts, but is rather deferred until the point that the query itself executes, usually because the table does not exist at the point the batch starts..

On table variable row estimations

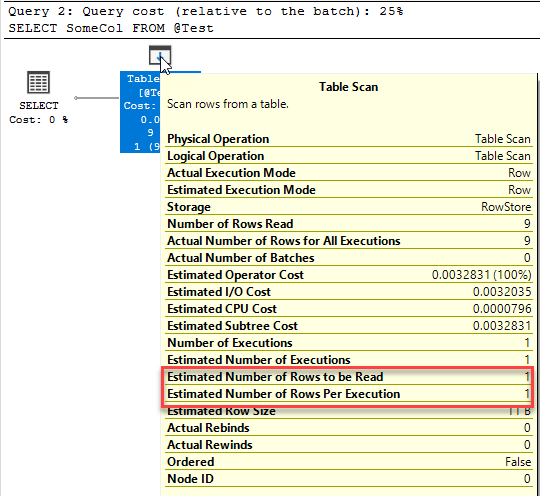
At first glance, the question of how many rows are estimated from a table variable is easy.

But, is it really that simple? Well, not really. To dig into the why, first we need to identify why table variables estimate 1 row. The obvious answer is because they don’t have statistics. However…

ALTER DATABASE CURRENT SET AUTO_CREATE_STATISTICS OFF
GO

CREATE TABLE Test (SomeCol INT);

INSERT INTO Test (SomeCol)
VALUES (1),(22),(37),(45),(55),(67),(72),(86),(91)

SELECT SomeCol FROM Test

SELECT * FROM sys.stats WHERE object_id = OBJECT_ID('Test')

DROP TABLE dbo.Test

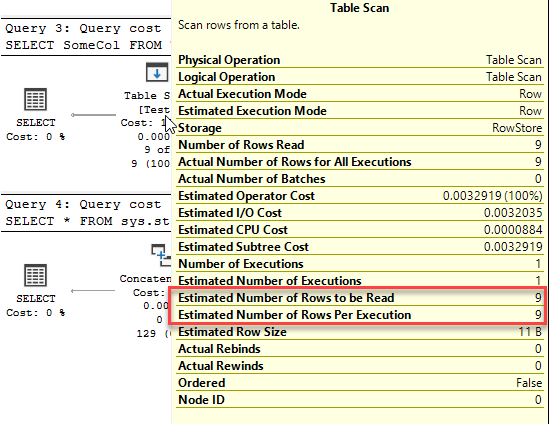
That table has no statistics, but it still estimates rows correctly.

So it’s not just the absence of statistics. Hmmm… Where else is there a difference with a table variable?

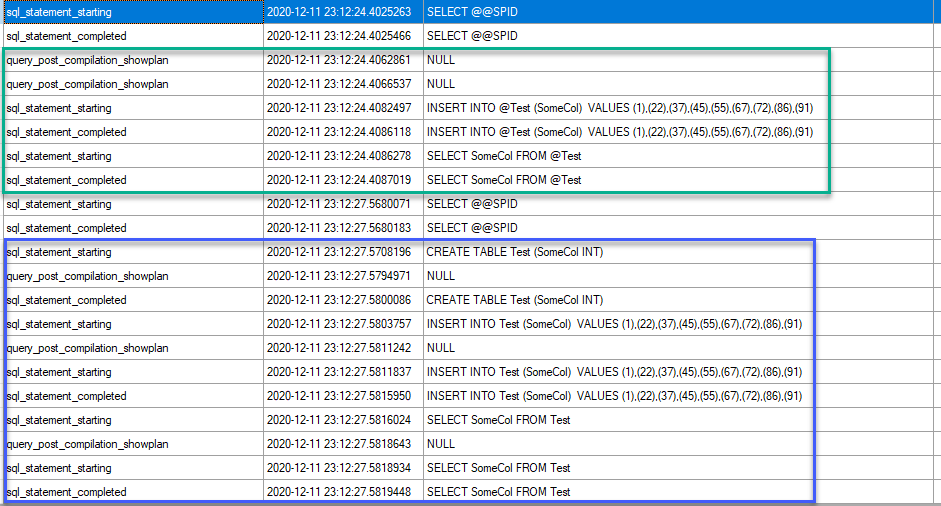
It has to do with when the plans are generated. The XE event results are from an event tracking statement start and end and the post-compilation event for the plan. For the query using the table variable, the entire batch is compiled before the execution starts. For the permanent table, there are multiple compilation events.

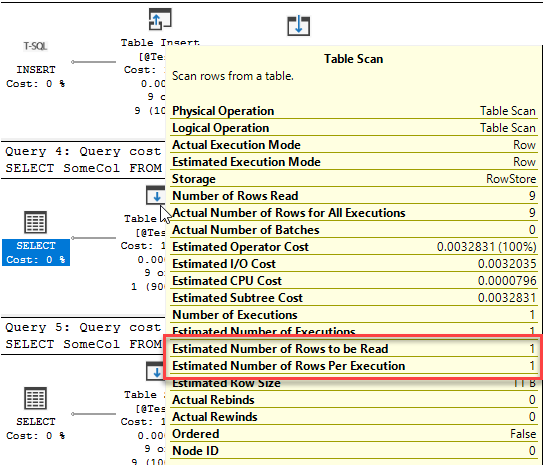
And this is because of something called ‘deferred compile’. For the table variable, the entire batch is compiled at the start, at a time where the table variable does not exist, and because there are no statistics, no recompile is triggered after the insert. Hence, there cannot be any row estimation other than 1 row, because the table did not exist when the estimate was made.

For the permanent table, the compilation of the query that uses the table is deferred until the query starts, not when the batch starts. Hence the plan for the query is generated after the table exists, after it’s been populated. That’s the difference here.

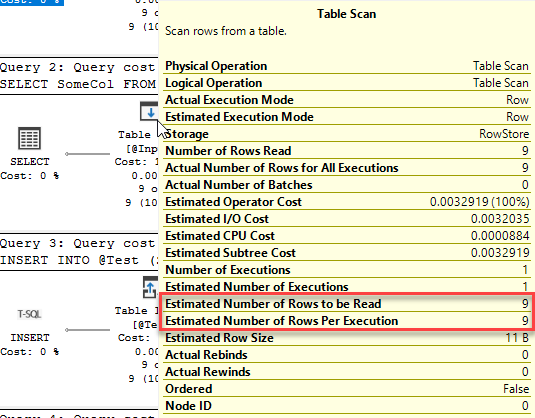
Now, there’s still no statistics, and so there’s no way to get data distribution, but that’s not the only way to get information on the rows in the table. The Storage Engine knows how many rows are in the table, though data distribution isn’t known.

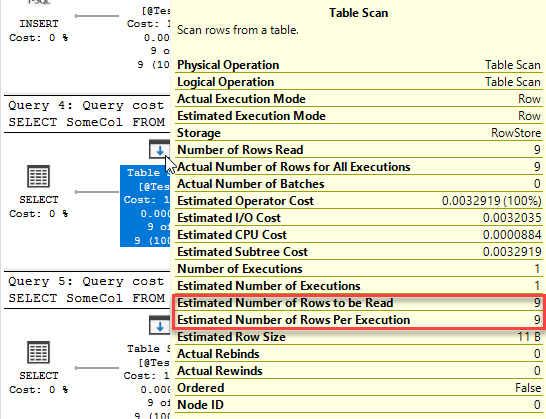
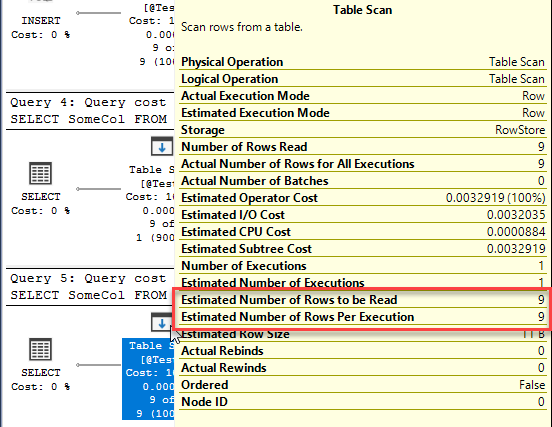
Hence, with a table variable we can expect to see an estimated row count other than 1 any time the table variable exists before the query that uses it is compiled.

That will happen when the table variable is a table-type parameter, when the query using it has the RECOMPILE option, and when SQL 2019’s deferred compile for table variables is in play.

CREATE OR ALTER PROCEDURE TestRowEstimations @Input TestTableType READONLY AS

SELECT SomeCol FROM @Input;

DECLARE @Test TABLE (SomeCol INT);

INSERT INTO @Test (SomeCol)
VALUES (1),(22),(37),(45),(55),(67),(72),(86),(91);

SELECT SomeCol FROM @Test;

SELECT SomeCol FROM @Test OPTION (RECOMPILE);
GO
Table-valued parameter
Normal select on compatibility mode 140
Normal select on compatibility mode 150
Select with OPTION(RECOMPILE)

Pluralsight Free April

It’s a few days into April, but not too late I hope to mention that Pluralsight is offering their entire library, free to new accounts, for the month of April. Sign up on their promotion page to take advantage of this offer.

And, I do have a few courses up there for anyone interested:

And there’s an upcoming course on index maintenance as well that I hope will be published shortly.

Books of 2019

I got sloppy with my book tracking this year, and completely stopped marking what I read on Goodreads part way through the year, hence no full list of what I read.

The high points of the books read however have to be the Expanse series (Babylon’s Ashes and Persepolis Rising were read this year). This series just keeps getting better, larger stakes, more problems. Looking forward to the final book.

Another series that I read that I’ve been thoroughly enjoying is the Starship Mage series. Last year saw the publication of “Sword of Mars“, where we find some answers, get a few massive battles and a really tense cliffhanger. Hope the next book comes out soon.

And the last book that I want to call attention to is “All those Explosions were Someone Else’s Fault“, which is a hilarious and interesting take on the superhero/supervillian genre. I highly recommend it.

I will try and do a better job this year of tracking my reading. My goal is again 75 books in a year, and I’m somewhat confident that I can make that number.

A new way of getting the actual execution plan

Getting the actual execution plan, that is the plan with run-time statistics for a query from an application has always been a little difficult. It’s fine if you can get the query running in Management Studio and reproducing the behaviour from the app, but that can be difficult.

There’s the query_post_execution_showplan event in Extended Events, but that’s a pretty heavy event and not something that I’d like to run on a busy server.

No more! SQL 2019 adds a new plan-related function to get the last actual plan for a query: sys.dm_exec_query_plan_stats.

The function is not available by default, Last_Query_Plan_Stats database scoped configuration has to be set  to allow it to run, and it’s going to add some overhead, how much is still to be determined.

ALTER DATABASE SCOPED CONFIGURATION SET LAST_QUERY_PLAN_STATS = ON

It’s a function which takes a parameter of a plan handle or a sql handle. Hence it can be used alone, or it can be on the right-hand side of an apply from any table or DMV that has a plan handle or sql handle in it. As an example it can be used with QueryStore.

WITH hist
AS (SELECT q.query_id, 
           q.query_hash,
           MAX(rs.max_duration)  AS MaxDuration
    FROM 
        sys.query_store_query q INNER JOIN sys.query_store_plan p ON q.query_id = p.query_id
        INNER JOIN sys.query_store_runtime_stats rs ON p.plan_id = rs.plan_id
        INNER JOIN sys.query_store_runtime_stats_interval rsi ON rs.runtime_stats_interval_id = rsi.runtime_stats_interval_id
    WHERE start_time < DATEADD(HOUR, -1, GETDATE())
    GROUP BY q.query_id, query_hash),
recent
AS (SELECT q.query_id, 
           q.query_hash,
           MAX(rs.max_duration)  AS MaxDuration
    FROM 
        sys.query_store_query q INNER JOIN sys.query_store_plan p ON q.query_id = p.query_id
        INNER JOIN sys.query_store_runtime_stats rs ON p.plan_id = rs.plan_id
        INNER JOIN sys.query_store_runtime_stats_interval rsi ON rs.runtime_stats_interval_id = rsi.runtime_stats_interval_id
    WHERE start_time > DATEADD(HOUR, -1, GETDATE())
    GROUP BY q.query_id, query_hash),
regressed_queries 
AS (
    SELECT hist.query_id, 
            hist.query_hash
        FROM hist INNER JOIN recent ON hist.query_id = recent.query_id
        WHERE recent.MaxDuration > 1.2*hist.MaxDuration
    )
SELECT st.text, OBJECT_NAME(st.objectid) AS ObjectName, qs.last_execution_time, qps.query_plan
    FROM sys.dm_exec_query_stats qs 
        CROSS APPLY sys.dm_exec_sql_text (qs.sql_handle) st
        OUTER APPLY sys.dm_exec_query_plan_stats(qs.plan_handle) qps
    WHERE query_hash IN (SELECT query_hash FROM regressed_queries)

The above query checks query store for any query that has regressed in duration in the last hour (defined as max duration > 120% of previous max duration) and pulls the last actual plan for that query out.

And a look at that plan tells me that I have a bad parameter sniffing problem, a problem that might have been missed or mis-diagnosed with only the estimated plan available.

In-line scalar functions in SQL Server 2019

Yes, yes, yes, finally!

It’s hardly a secret that I’m not a fan of scalar user-defined functions. I refer to them as ‘developer pit-traps’ due to the amount of times I’ve seen developers absolutely wreck their database performance by over-using them (or using them at all).

The main problem with them is that they haven’t been in-line, meaning the function gets evaluated on every single row, and the overhead from doing so is usually terrible.

One of the improvements in SQL Server 2019 is that scalar user-defined functions now are in-line. Not all of them, there are conditions that have to be met. Most scalar UDFs that I’ve seem in client systems will meet them, the not referencing table variables will probably be the main limiting factor.

The full requirements are laid out in the documentation: https://docs.microsoft.com/en-us/sql/relational-databases/user-defined-functions/scalar-udf-inlining

I’m going to use the same function that I used when I evaluated natively-compiled functions (https://www.sqlinthewild.co.za/index.php/2016/01/12/natively-compiled-user-defined-functions/), and run it against a table with 860k rows in it, both in compat mode 140 (SQL Server 2017) and compat mode 150 (SQL Server 2019)

CREATE FUNCTION dbo.DateOnly (@Input DATETIME)
  RETURNS DATETIME
AS
BEGIN
  RETURN DATEADD(dd, DATEDIFF (dd, 0, @Input), 0);
END
GO

As in the earlier post, I’ll use extended events to catch the performance characteristics.

First, something to compare against. The query, without functions, is:

SELECT DATEADD(dd, DATEDIFF (dd, 0, TransactionDate), 0) FROM Transactions

This takes, on average,  343ms to run, and 320ms of CPU time.

The results of the first test are impressive.

Compat ModeDuration (ms)CPU (ms)
14010 6668594
150356353

I keep having people ask about SCHEMABINDING, so same test again, with the function recreated WITH SCHEMABINDING

Compat ModeDuration (ms)CPU (ms)
14054483818
150325320

Better, but still over an order of magnitude slower than the query without the function in SQL 2017 and earlier.

Last test, what about something with data access? I’ll switch to my Shipments and ShipmentDetails tables for this. The base query without the function is:

SELECT s.ShipmentID, 
    (SELECT SUM(Mass) AS TotalMass FROM ShipmentDetails sd WHERE sd.ShipmentID = s.ShipmentID) TotalShipmentMass
FROM Shipments s;

I’m writing it with a subquery instead of a join to keep it as similar as possible to the version with the function. It should be the same as if I had used a join though. That query takes, on average, 200ms, with 145ms CPU time.

There are 26240 rows in the Shipments table, and on average 34 detail rows per shipment. The function is:

CREATE FUNCTION dbo.ShipmentMass(@ShipmentID INT)
RETURNS NUMERIC(10,2)
AS
BEGIN
    DECLARE @ShipmentMass NUMERIC(10,2);
    SELECT @ShipmentMass = SUM(Mass) FROM ShipmentDetails sd WHERE sd.ShipmentID = @ShipmentID;

    RETURN @ShipmentMass;

END

And the results are:

Compat ModeDuration (ms)CPU (ms)
140961 211 (16 minutes)959 547
15032803272

The test under compat mode 140 had to be run overnight. 9 hours to run the query 25 times… And people wonder why I complain about scalar user-defined functions in systems.

Under compat mode 150 with the inline function it’s way better (3 seconds vs 16 minutes for a single execution), but it’s still over an order of magnitude slower than the same query with the subquery. I’ll test this again after RTM, but for the moment it look like my guidance for functions for SQL 2019 going forward is going to be that scalar functions that don’t access data are fine, but scalar functions that do should still be replaced by inline table-valued functions or no function at all, wherever possible.

No, this is not a bug in T-SQL

(or, Column scope and binding order in subqueries)

I keep seeing this in all sorts of places. People getting an unexpected result when working with a subquery, typically an IN subquery, and assuming that they’ve found a bug in SQL Server.

It’s a bug alright, in that developer’s code though.

Let’s see if anyone can spot the mistake.

We’ll start with a table of orders.

CREATE TABLE Orders (
  OrderID INT IDENTITY PRIMARY KEY,
  ClientID INT,
  OrderNumber VARCHAR(20)
)

There would be more to it in a real system, but this will do for a demo. We’re doing some archiving of old orders, of inactive clients. The IDs of those inactive clients have been put into a temp table

CREATE TABLE #TempClients (
ClientD INT
);

And, to check before running the actual delete, we run the following:

SELECT * FROM dbo.Orders
WHERE ClientID IN (SELECT ClientID FROM #TempClients)

And it returns the entire Orders table. The IN appears to have been completely ignored. At least the query was checked before doing the delete, that’s saved an unpleasant conversation with the DBA if nothing else.

Anyone spotted the mistake yet?

It’s a fairly simple one, not easy to see in passing, but if I test the subquery alone it should become obvious.

The column name in the temp table is missing an I, probably just a typo, but it has some rather pronounced effects.

The obvious next question is why the select with the subquery in it didn’t fail, after all, the query asks for ClientID from #TempClients, and there’s no such column. However there is a ClientID column available in that query, and it’s in the Orders table. And that’s a valid column for the subquery, because column binding order, when we have subqueries, is first to tables within the subquery, and then, if no match is found, to tables in the outer query.

It has to work this way, otherwise correlated subqueries would not be possible. For example:

SELECT c.LegalName,
c.HypernetAddress
FROM dbo.Clients AS c
WHERE EXISTS (SELECT 1 FROM dbo.Shipments s WHERE s.HasLivestock = 1 AND c.ClientID = s.ClientID)

In that example, c.ClientID explicitly references the Client table in the outer query. If I left off the c., the column would be bound to the ClientID column in the Shipments table.

Going back to our original example…

SELECT * FROM dbo.Orders
WHERE ClientID IN (SELECT ClientID FROM #TempClients)

When the query is parsed and bound, the ClientID column mentioned in the subquery does not match any column from any table within the subquery, and hence it’s checked against tables in the outer query, and it does match a column in the orders table. Hence the query essentially becomes

SELECT * FROM dbo.Orders
WHERE ClientID IN (SELECT dbo.Orders.ClientID FROM #TempClients)

Which is essentially equivalent to

SELECT * FROM dbo.Orders
WHERE 1=1

This is one reason why all columns should always, always, always, be qualified with their tables (or table aliases), especially when there are subqueries involved, as doing so would have completely prevented this problem.

SELECT * FROM dbo.Orders o
WHERE o.ClientID IN (SELECT tc.ClientID FROM #TempClients tc)

With the column in the subquery only allowed to be bound to columns within the #TempClients table, the query throws the expected column not found error.

And we’re no longer in danger of deleting everything from the orders table, as we would have if that subquery had been part of a delete and not a select.

Comparing plans in Management Studio

Previously I looked at using Query Store to compare execution plans, but it’s not the only way that two execution plans can be compared. The other method requires a saved execution plan and the Management Studio execution plan viewer.

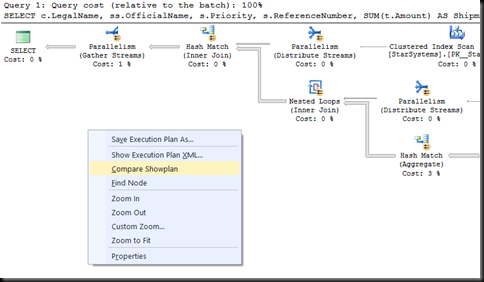
Let’s start by assuming I have a saved execution plan for a query and I want to compare it to the execution plan that the same query currently has. First step is to run the query with actual execution plan on. Right-click on the execution plan and select ‘Compare Showplan’

ComparePlans2

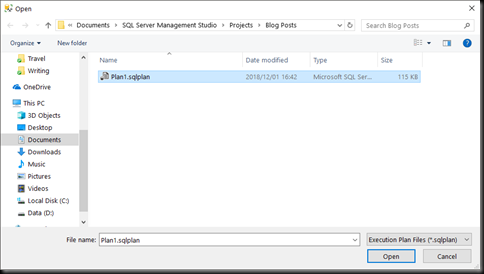
Pick a saved execution plan. It doesn’t have to be for the same query, but the comparison will be of little use if the two plans being compared are not from the same query.

ComparePlansFindPlan

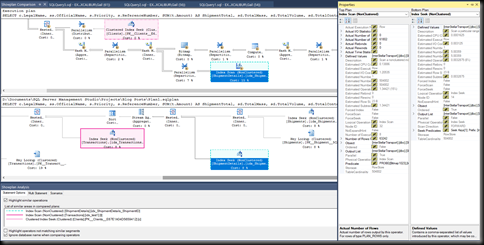
And then we get the same comparison screen as we saw last time with the comparison via Query Store. Similar portions of the plan are marked by coloured blocks, and the properties window shows which properties differ between the two plans.

ComparePlansDetail2