SQL Server

Corruption month

There’s been a rash of database-corruption posts recently. On the two forums that I read, there have so far been around 12 corruption-related problems so far this month. That’s frightening. Many of the problems were only solved either with some data loss or with a lot of work, or both. So what are the two things that most of these cases had in common.

  1. No backups
  2. No corruption checks

Backups

Having no backups is pretty inexcusable, whether its because no backups were scheduled or whether it’s because the backups were failing. Paul’s written about the importance of the right backups, and I’m not going to repeat him here.

Just having backups is not sufficient. The backups have to be restorable. A backup that’s not restorable is, in my opinion, worse than no backup at all. That means that the jobs have to be checked to ensure that they did run without error and the backups have to be restored somewhere to test them. Ultimately that’s the only way to be 100%, absolutely sure that a backup is restorable.

(more…)

High Availability != Backups

Backup solutions are not the same as high availability solutions. They have different purposes and picking the wrong one for the wrong reasons may be disasterous.

A backup solution is a one that creates separate copies of data that can be used to restore the original in the case of data loss. A high availability solution is one designed to keep a system usable and available in the face of hardware (or similar) failures

Solutions like RAID, database mirroring, clustering and SAN replication are forms of high availability. They are not backup solutions and cannot replace good database backups. Having the database on a RAID array will not help if the DB becomes corrupt. SAN replication or database mirroring is of no use if a user somehow deletes critical records.

On the other hand, a backup strategy, however good, is not going to help much when a critical piece of hardware burns out and the business will be losing millions if the app’s not up within 10 minutes. If the app is critical, both backups and an appropriate high availability solution have to be considered. Picking the right high availability solution is complex. Entire books have been written on it.

The only time having no backups at all is an acceptable option is if it’s a system where the data can be completely recreated from another source with no difficulties (example here would be a reporting database that’s replicated directly from a different server)

Here’s another take on backups – http://www.sqlskills.com/BLOGS/PAUL/post/Importance-of-having-the-right-backups.aspx

Functions, IO statistics and the Execution plan

It’s no secret that I’m not overly fond of most user-defined functions. This isn’t just a pet hate, I have some good reasons for disliking them. All too often they’re performance bottlenecks, but that can be said about many things in SQL. The bigger problem is that they’re hidden performance bottlenecks that often go overlooked and ignored for too long.

I’m going to start with this fairly simple scalar function, created in the AdventureWorks database

Create function LineItemTotal(@ProductID int)
returns money
as
begin
declare @Total money

select @Total = sum(LineTotal) from sales.SalesOrderDetail where productid = @ProductID

return @Total
end

So, given that function, the following two queries should be equivalent.

SELECT productid, productnumber, dbo.LineItemTotal(productid) as SumTotal
FROM Production.Product p

SELECT productid, productnumber,
(select sum(LineTotal) from sales.SalesOrderDetail where productid = p.productid) AS SumTotal
FROM Production.Product p

No problems so far. They both return 504 rows (in my copy of AW, which has been slightly padded out with more data). Now, let’s look at the execution characteristics by running them again with Statistics IO and Statistics Time on.

Query 1, the one with the scalar function:

Table ‘Product’. Scan count 1, logical reads 4, physical reads 0.

SQL Server Execution Times:
CPU time = 47297 ms,  elapsed time = 47541 ms.

Query 2, the one with the correlated subquery:

Table ‘Worktable’. Scan count 0, logical reads 0, physical reads 0.
Table ‘SalesOrderDetail’. Scan count 3, logical reads 22536, physical reads 0.
Table ‘Product’. Scan count 3, logical reads 40, physical reads 0.

SQL Server Execution Times:
CPU time = 1047 ms, elapsed time = 1249 ms.

(more…)

On Counts

Or “What’s the fastest way to count the rows?”

It’s a fairly common to need to know the number of rows in a table, the number of rows that match a certain condition or whether or not there are any rows that match a condition. There’s also a number of ways of doing so, some better than others. The problem being that counting is not a cheap operation, especially on big tables. It’s not as bad as a sort, but it still can be expensive.

So, given that, let’s take a look at some of the ways.

Querying the metadata

If all that’s needed is the number of rows in the table, and it’s not 100% important that the value be completely accurate all the time, the system metadata can be queried. In SQL 2000 and below, that info was in sysindexes. In 2005 and higher it’s been moved into sys.partitions.

SELECT OBJECT_NAME(object_id) AS TableName, SUM(rows) AS TotalRows
FROM sys.partitions
WHERE index_id in (0,1)
AND object_id = OBJECT_ID('TableName')
GROUP BY object_id

The advantage of this approach is that it is fast. Since it’s not actually counting anything and, in fact, isn’t even accessing the table that’s being counted, it’s the fastest way to get the count of rows in the table.

The disadvantage is it can only get the number of rows in the table and cannot consider any criteria at all. It also may not be 100% accurate, depending how and when the table’s rowcount metadata is updated by the SQL engine. (more…)

Dynamic SQL and SQL injection

When I wrote about the catch-all queries, someone asked why the dynamic SQL that I offered wasn’t vulnerable to SQL injection. I thought I’d go into the whys and the wherefores of that in a little bit more detail.

I’m just going to look at SQL injection from the aspect of dynamic SQL. The front-end code aspect has been dealt with hundreds of times, most recently here – http://www.simple-talk.com/community/blogs/philfactor/archive/2009/03/30/72651.aspx

The most important thing to realise with SQL Injection (and with all other forms of command injection) is that it requires that a user-inputted string be incorperated as part of a command that’s going to be executed. Not as part of a paramter value, but as part of the command itself.

Let me show you want I mean.

DECLARE @sSQL varchar(500)
SET @sSQL = 'SELECT * FROM sys.objects'

EXECUTE (@sSQL)

In this exeedingly simple example, there’s no possibility for SQL injection. There’s no user-inputted string that can become part of the command. Let’s look at two slightly more complex examples

Example 1:


DECLARE @inputParam VARCHAR(100) -- Assume this comes from user input
DECLARE @sSQL varchar(500)

SET @sSQL = 'SELECT * FROM '

IF @inputParam = 'Table1'
SET @sSQL = @sSQL + 'Table1'
IF @inputParam = 'Table2'
SET @sSQL = @sSQL + 'Table2'
IF @inputParam = 'Table3'
SET @sSQL = @sSQL + 'Table3'
IF @inputParam = 'Table4'
SET @sSQL = @sSQL + 'Table4'

EXECUTE (@sSQL)

Example 2:


DECLARE @inputParam VARCHAR(100) -- Assume this comes from user input
DECLARE @sSQL varchar(500)

SET @sSQL = 'SELECT * FROM ' + @inputParam

EXECUTE (@sSQL)

(more…)

Catch-all queries

13 March 2018: There is an updated post on this subject – https://www.sqlinthewild.co.za/index.php/2018/03/13/revisiting-catch-all-queries/

The query form that I refer to as ‘Catch-all’ typically results from search screens in the application where the user may enter any one (or more) of a number of optional parameters. One of the more common ways for such a query to be written in SQL is with multiple predicates in the where clause of the form (WHERE SomeColumn = @SomeVariable OR @SomeVariable IN NULL)

Now this does work, the problem is that it works fairly inefficiently and, on large tables, can result in really poor query performance. I’m going to take a look at why that is the case and what alternatives there are.

Erland Sommarskog has written on this as well, and in a lot more detail than I’m going to. His article on dynamic search conditions is well worth reading, as are the rest of his articles.

A typical example of a ‘catch-all’ query would be this one, based off a table in the AdventureWorks database.

CREATE PROCEDURE SearchHistory
(@Product int = NULL, @OrderID int = NULL, @TransactionType char(1) = NULL, @Qty int = NULL)
AS
SELECT ProductID, ReferenceOrderID, TransactionType, Quantity,
TransactionDate, ActualCost from Production.TransactionHistory
WHERE (ProductID = @Product Or @Product IS NULL)
AND (ReferenceOrderID = @OrderID OR @OrderID Is NULL)
AND (TransactionType = @TransactionType OR @TransactionType Is NULL)
AND (Quantity = @Qty Or @Qty is null)
GO

Now, let’s say that I run that query and pass values for the ProductID and the Transaction type. Let’s further say that there’s a nonclustered index (called idx_TranHistory_TranTypeProductID) on those two columns.

EXEC SearchHistory @Product = 978, @TransactionType = 'W'

Now this returns 52 rows out of 980000 that are in the table, so we’d expect that SQL would use an index seek operation on that index, followed by a bookmark lookup.
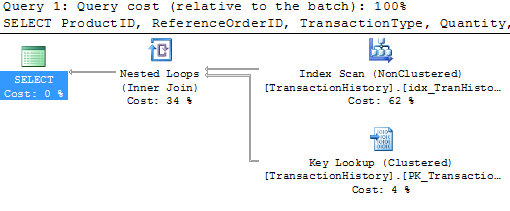
Nope. It’s using that index all right, but it’s doing a scan, not a seek. Ok, not great, but not bad. Let me try a different set of parameters

EXEC SearchHistory @Qty = 100

The plan’s exactly the same. No surprise, it was cached the first time and then reused. There’s a problem here though, the index that’s used is completely inappropriate and there’s a bookmark lookup that ran almost a million times. No wonder this execution took 3 seconds and 2,949,715 IOs to return 29 rows.

Ok, so let me try a different form of the catch-all query

CREATE PROCEDURE SearchHistory_Improved
(@Product int = NULL, @OrderID int = NULL, @TransactionType char(1) = NULL, @Qty int = NULL)
AS
SELECT ProductID, ReferenceOrderID, TransactionType, Quantity, TransactionDate, ActualCost from Production.TransactionHistory
WHERE (ProductID = CASE WHEN @Product IS NULL THEN ProductID ELSE @Product END)
AND (ReferenceOrderID = CASE WHEN @OrderID IS NULL THEN ReferenceOrderID ELSE @OrderID END)
AND (TransactionType = CASE WHEN @TransactionType IS NULL THEN TransactionType ELSE @TransactionType END)
AND (Quantity = CASE WHEN @Qty IS NULL THEN Quantity ELSE @Qty END)
GO

Let’s see what that does for the first test:

EXEC SearchHistory_Improved @Product = 978, @TransactionType = 'W'
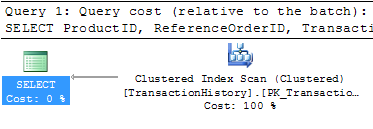
Well that’s no better. Full blown table scan.

The problem with these types of queries is that there is no stable plan. The optimal plan differs completely depending on what paramters are passed. The optimiser can tell that and it plays safe. It creates plans that will always work. That’s (one of the reasons) why in the first example it was an index scan, not an index seek.

The downside of the safe plan is that it’s highly unlikely to be a good plan and, even if it is, it won’t be good for all possible combinations of plans.

So, how to handle this type of query? Well, there are typically two ways.

Recompile

This is only an option on SQL 2008. On 2008, if the query is specified with the OPTION (RECOMPILE) hint, then the optimiser knows it doesn’t have to worry about safe plans because the plan will never be reused. In fact, if I add that hint to the query in the first example, I get the expected index seek.

Dynamic SQL

The other option is to build up the query string dynamically, based on the parameters passed and then to use sp_executesql to run it. There are the ususal downsides to dynamic SQL but, it may be that the performance improvement is worth it.

CREATE PROCEDURE SearchHistory_Dynamic (@Product int = NULL, @OrderID int = NULL, @TransactionType char(1) = NULL, @Qty int = NULL)
AS
DECLARE @sSQL NVARCHAR(2000), @Where NVARCHAR(1000) = ''
SET @sSQL = 'SELECT ProductID, ReferenceOrderID, TransactionType, Quantity, TransactionDate, ActualCost
from Production.TransactionHistory '

IF @Product is not null
SET @Where = @Where + 'AND ProductID = @_Product '
IF @OrderID is not null
SET @Where = @Where + 'AND ReferenceOrderID = @_OrderID '
IF @TransactionType IS NOT NULL
SET @Where = @Where + 'AND TransactionType = @_TransactionType '
IF @Qty IS NOT NULL
SET @Where = @Where + 'AND Quantity = @_Qty '

IF LEN(@Where) > 0
SET @sSQL = @sSQL + 'WHERE ' + RIGHT(@Where, LEN(@Where)-3)

EXEC sp_executesql @sSQL,
N'@_Product int, @_OrderID int, @_TransactionType char(1), @_Qty int',
@_Product = @Product, @_OrderID = @OrderID, @_TransactionType = @TransactionType, @_Qty = @Qty

GO

Note that there’s no SQL injection vulnerability in this. The parameters are never concatenated into the string and the execution is parametrised.

Now each different set of parameters gets a different cached plan, optimal for that particular set of parameters.

EXEC SearchHistory_Dynamic @Product = 978, @TransactionType = 'W'

EXEC SearchHistory_Dynamic @Qty = 100

The first gets an index seek, the second a clustered index scan (because there’s no index on Quantity). Much better than the behaviour with the earlier non-dynamic versions.

When is a seek actually a scan?

Most people who know SQL execution plans will say, without reservation, that an index seek on a particular index is better than an index scan on the same index. In the vast majority of cases, that’s true, but there are times when what appears in the execution plan as an index seek is actually an index scan.

Let me show an example


CREATE TABLE TestingSeeks (
id int identity (1,1) not null,
SomeStr char(6) default '' -- a filler
)
GO

insert into TestingSeeks (SomeStr)
select top (500000) ''
from sys.columns c1 cross join sys.columns c2

We have a table here with an identity column on it, starting at 1 and incrementing by 1 row. Hence, there will be no negative values in the table. I’m going to then put a nonclustered index on that column (the table has no cluster, it’s a heap)


CREATE NONCLUSTERED INDEX idx_Seek ON TestingSeeks (id)

Fair enough. If I query all the rows in the table and retrieve just the ID column, I’ll get a scan on that index, as is pretty much expected and Statistics IO tells me that 935 pages were read

(more…)

Estimated and Actual execution plan revisited

After an interesting discussion on SQLServerCentral last week, I realised that the terms ‘estimated execution plan’ and ‘actual execution plan’ are perhaps a little bit misleading.

The only thing estimated about the estimated execution plan is the rowcounts, costs and row size. The plan itself isn’t an estimate. It’s not as if the optimiser, when asked for an estimated plan, does a less thorough job than when asked to compile a plan for a query’s execution.

The two forms of execution plan are better described as ‘execution plan with run-time information’ and ‘execution plan without run-time information’

When, in Management Studio, someone clicks the ‘display estimated execution plan’ button, the query is submitted to SQL Server, parsed and bound, algebratised and optimised just as if it was going to be executed. But the query is not executed, and as such, the plan when returned contains no run time information.

If there is a matching cached query plan, that cached plan is what’s returned and no optimisation is done. This can be seen by using profiler with the Cache hit, cache miss and cache insert events being traced.

When, in Management Studio, the query is run with the execution plan option enabled, the query is submitted to SQL Server, parsed and bound, algebratised, optimised and executed. The returned plan does contain the run-time for that specific execution, hence the plan contains things like ‘actual row count, actual IO cost’, etc

If there’s a matching query plan in cache then that cached plan will be used for the query’s execution and will be the one returned, though with the run-time information added

When a plan is cached, only the compile-time information is cached. The detailed run-time information on the actual number of rows and actual executions is discarded after updating the aggregated query stats. Hence, when you retrieve a query from the plan cache, it will not contain the run-time information. Consider a plan that’s been used 20 times. Which execution’s run-time information would it contain? Remember that there’s only one plan in cache per procedure.

Hence, a plan fetched from cache will be identical to the plan returned by requesting the estimated execution plan for a specific query (Providing there’s nothing happening to invalidate the cached plan)

Profiler can capture (depending on event) the plan without the run-time information or the plan with the run-time information. There’s a nice table in chapter 2 of one of Itzik’s books that shows the various profiler events, when they fire and what they return.