SQL Server

Identifying inaccurate statistics

I wrote previously about statistics, what they’re needed for and I briefly mentioned what can happen when they’re inaccurate.

One question I’ve seen asked a few times is on how to identify stats that are inaccurate, what DMV to use. The bad new is that there is no DMV that identifies inaccurate statistics. The Stats_Date function can be used to see when the stats were last updated, but that doesn’t say if that was too long ago ort not. If a table is readonly, or is changed twice a year, statistics that are four months old are perfectly valid.

The rowmodcnt column in sysindexes can give an approximate count of the number of rows that have changed since the stats were last updated, although sysindexes is deprecated and will disappear in the next version of SQL and the rowmodcnt column is no longer completely accurate. The rowmodcnt however is just a count of changes. It gives no indication of whether that number is too high and causing a problem. In some cases 50% of the table may have changed before there’s a problem with queries. In other cases 5% is enough to cause problems.

(more…)

What are statistics and why do we need them?

Statistics are another area of SQL that seem to be fairly poorly understood, on what they are, how they are used and how they are maintained..

Statistics store information about the distribution of data in the columns. The information includes the density of the key columns which gives a measure of the uniqueness of the index, and a histogram that stores information on how the distribution of values within the column.

Creating statistics

When an index is created, statistics will automatically be created on the index columns. The stats on an index cannot be dropped while the index exists. If the index is a multi-column one, the density is stored for all columns, but the histogram is only stored for the leading column.

It’s also possible to have statistics that aren’t associated with indexes. These are created automatically by the query optimiser (providing auto_create_statistics is enabled) or they can be created manually with the CREATE STATISTICS statement.

It’s not usually necessary to create statistics manually as the optimiser usually knows best what stats are required.

Updating Statistics

SQL keeps a count of the number of changes to a column and will update the statistics when it deems sufficient changes to have occurred (providing auto_update_stats is enabled).The stats are not updates as part of a data modification. Rather the next select that requires those statistics will trigger the update. In most cases, the auto-update doesn’t cause problems. It runs in the read-uncommitted isolation level and hence won’t cause blocking and SQL will, by default, only sample a portion of the table to calculate the stats.

(more…)

What is fragmentation?

It’s common knowledge that SQL indexes become fragmented over time and should be rebuilt to remove that fragmentation. But what exactly is fragmentation?

First, a little bit on index structure.

The index key defines the logical order of the index leaf pages. Each page has two pointers, one to the previous page and one to the next page in the index.

A hypothetical index on an integer column

In an ideal situation, the logical order of the pages would correspond to the physical order, and a page with higher index key values  would have a higher page number (corresponding to physical position in the file) than a page with lower index key values.

If that is the case for all pages in the index leaf level, then the index has no fragmentation. Unfortunatly, that is not normally the case. Inserts and updates to the index can cause page splits. A page split moves half the rows on one of the index leaf pages to a new page and then linkes that page into the chain. It’s unlikely that a free page will be in the correct physical logation in the file and hence after the page split, the physical and logical ordering of the pages will no longer be the same.

(more…)

Execution plan – more properties

I ran across a few more properties visible in the exec plan that I thought would be useful to people. So, without further ado…

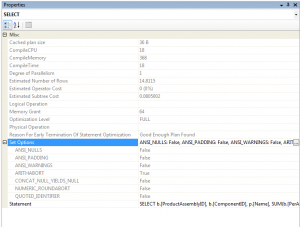
Some overall properties of the entire execution can be seen by selecting the highest-level operator in the plan (the one on the left-most, typically the select, insert, update or delete operator) and then opening the properties window

The first four items, the compild plan size, compile CPU, compile Time and compile Memory all refer to the optimisation process that the query went through. They indicate how much in the way of server resources was spent compiling this query and how large the cached plan is in memory.

This can be important when dealing with queries that recompile often or are very seldom reused

(more…)

Do wide indexes slow queries down?

I got asked this question during one of my TechEd sessions. It was a bit complex to answer there and then, so I answered by mail a few days later, and I thought it would make a good blog post if expanded a bit more.

Assume a table with 5 columns (imaginatively called A, B, C, D and Z). A and B are ints, C is a datetime and D is a char(50). Let’s assume that Z is an int, identity, primary key and has the clustered index

If I put an index on A and B, the size of the index key (ignoring headers and other overhead) is 8 bytes. Add in the clustering key for row location and each index leaf record in 12 bytes wide. That means that (at 100% fill factor) there are around 660 index rows per leaf page. Since I’m ignoring headers, this rough calc will not exactly match reality, but it’s close enough.

If the table has 100000 rows, the the leaf level of the index consists of 152 pages.

To calculate the number of pages above, one should know that for each leaf page, the next level higher has one index row in – the first value on the page. Hence, for 152 leaf pages, the level above will have 152 index rows as 12 bytes each totalling 1824 bytes. This will fit on one page, so the level above the leaf is the index root, and this index has only two levels.

To seek a single row from this index hence requires 2 page reads.

(more…)

Get it while it's hot

The first cumulative update for SQL 2008 is available. Thanks to Aaron who caught the scoop on this one.

There’s a whole bunch of assorted fixes, mostly (it appears) for reporting services, a couple of T-SQL fixes (including one for the merge statement which sometimes won’t enforce foreign keys), a few analysis services fixes and a couple for the tools (mostly intellisense).

Overall, there doesn’t appear to be anything too major in the fix list.

The one really interesting thing about this fix is that it can be run before SQL is installed. If it is, updates setup files will be placed on the machine so that when SQL is installed, the fixed setup files will be run and not the ones on the DVD/download. That’s a really nice feature.

Bob Ward posted a whole blog post on how that works and how to go about it: How to fix your SQL Server 2008 Setup before you run setup…

Deadlock Graphs

A deadlock can appear to be a very obtuse error, as the only advice offered with the error message is an instruction to ‘rerun the transaction’, and there’s no apparent way to find the cause of the deadlock.

There are in fact several ways to get information on what caused the deadlock and on what resources the deadlock occurred. This information is generally referred to as the ‘deadlock graph’

Traceflag 1204

This is the oldest of the ways to get at the deadlock graph and it’s the main way used on SQL 2000. If traceflag 1204 is enabled server-wide, either by adding it as a startup parameter or by using the TraceOn command (DBCC TRACEON(1204,-1)), then anytime the SQL deadlock detector detects and resolves a deadlock, the information on that is written into the SQL Server error log. It looks something like this:

[source:XML] Deadlock encountered …. Printing deadlock information
Wait-for graph

Node:1

OBJECT: 12:629577281:0         CleanCnt:3 Mode:S Flags: 0x1
Grant List 2:
Owner:0x000000008673B900 Mode: S        Flg:0x40 Ref:2 Life:02000000 SPID:52 ECID:0 XactLockInfo: 0x0000000085F64ED0
SPID: 52 ECID: 0 Statement Type: UPDATE Line #: 11
Input Buf: Language Event: exec CauseDeadlock
Requested by:
ResType:LockOwner Stype:’OR’Xdes:0x0000000085F65740 Mode: IX SPID:53 BatchID:0 ECID:0 TaskProxy:(0x0000000085F5C538) Value:0x85b66a00 Cost:(0/0)

Node:2

OBJECT: 12:629577281:0         CleanCnt:3 Mode:S Flags: 0x1
Grant List 2:
Owner:0x00000000867FA180 Mode: S        Flg:0x40 Ref:2 Life:02000000 SPID:53 ECID:0 XactLockInfo: 0x0000000085F65780
SPID: 53 ECID: 0 Statement Type: UPDATE Line #: 11
Input Buf: Language Event: exec CauseDeadlock
Requested by:
ResType:LockOwner Stype:’OR’Xdes:0x0000000085F64E90 Mode: IX SPID:52 BatchID:0 ECID:0 TaskProxy:(0x00000000810B8538) Value:0x85b66a40 Cost:(0/0)

Victim Resource Owner:
ResType:LockOwner Stype:’OR’Xdes:0x0000000085F65740 Mode: IX SPID:53 BatchID:0 ECID:0 TaskProxy:(0x0000000085F5C538) Value:0x85b66a00 Cost:(0/0) [/source]

(more…)

Comparing date truncations

Removing the time from a datetime is a task that comes up again and again and it sometimes seems like everyone’s got their own favorite way of doing it. I though I’d take a run through some of the ways I’ve seen and see how the compare in terms of performance.

The methods that I’ll be comparing are:

  1. Cast to varchar and back to datetime
  2. Cast to float, floor and cast back to datetime
  3. Use dateadd and datediff to get rid of the time
  4. Cast to date and back to datetime (SQL 2008 specific)

I ran each one 4 times and averaged the results

CREATE TABLE #DateTest (
ID INT IDENTITY(1,1) PRIMARY KEY CLUSTERED,
DateValue  DATETIME
)

INSERT INTO #DateTest (DateValue)
SELECT TOP 1000000
DATEADD(mi,RAND(s1.number*5000 + s2.number)*5000,'2000/01/01' )
FROM master..spt_values s1 CROSS JOIN master..spt_values s2
WHERE s1.[name] IS NULL AND s2.NAME IS null
GO

SET NOCOUNT ON
GO
SET STATISTICS TIME ON
GO

SELECT dateadd(dd, datediff(dd,0, DateValue),0)
FROM #DateTest
GO 4

SELECT convert(datetime,convert(varchar(10),DateValue,101))
FROM #DateTest
GO 4

SELECT CAST(FLOOR(CAST(DateValue AS FLOAT)) AS DATETIME)
FROM #DateTest
GO 4

SELECT CAST(CAST(DateValue AS DATE) AS DATETIME)
FROM #DateTest
GO 4

DROP TABLE #DateTest

And so, the winner of the date challenge:

  1. Dateadd and datediff – CPU time 348ms, execution time 8092 ms
  2. Cast to float and floor – CPU time 395ms, execution time 8270ms
  3. Cast to varchar – CPU time 1450ms, execution time 9280ms
  4. Cast to Date – CPU time 3063ms, execution time 7905ms

I was not expecing the cast to Date to take so much processing time. I think I’m going to take a look at the new date types in more detail, see what they perform like.

Renamed 'sa' and SQL 2008 upgrade

In a nutshell, it doesn’t work.

There are a number of places in one of the upgrade scripts where the ‘sa’ login name is hardcoded into the script. If, as is possible on SQL 2005, the sa account has been renamed, the upgrade fails and leaves the SQL installation in a state where it cannot be used.

For all the gory details – Connect item 364566

There’s a slightly dodgy workaround listed on the connect site, but the best thing is to make sure that sa is renamed back to sa before attempting a SQL 2008 upgrade.

Update: There’s another workaround for this, other than creating a fake sa account. The PSS Engineers are working on a blog post and KB article. I’ll link to them once the articles are available.

Update: Bob Ward posted a long blog post on this, including a way to fix the broken SQL 2008 service without creating fake ‘sa’ accounts. There is more to come still on this one.

An example exec plan

Back to the technical posts…

I’m going to take an example of a very simple execution plan that I used in a presentation a few weeks back and go over it in some detail, pointing out information that is available and what can be read from the plan.

The execution plan can be downloaded (in xml format) here – ExecPlanDem01.zip

The query that the plan came from is a very simple two table query. It’s not a very optimal plan, but that’s because I forced an index hint in order to generate a more interesting plan. Without the hint, it’s a simple exec plan with two index seeks and a nested loop join.

Overview

The first thing that can be seen from the execution plan is that most of the cost of the query is in two operations, a key lookup (formerly called a bookmark lookup) and a clustered index seek. The high cost of the key lookup is a good sign that the query is using an inappropriate index. (in a future post I’ll discuss using the exec plan to choose indexes)

(more…)