Performance

To TOP or not to TOP an EXISTS

Earlier this year I had a look at a query pattern that I often see on forums and in production code, that of the Distinct within an IN subquery. Today I’m going to look at a similar patters, that being the use of TOP 1 within an EXISTS subquery.

Three tests. First a straightforward exists with no correlation (no where clause linking it to an outer query). Second, an exists with a complex query (one with a non-sargable where clause and a group by and having). Third an exists subquery correlated to the outer query.

Table structures are nice and simple, in fact, for ease I’m going to use the same tables as I did back on the exists, in and inner join tests. Code to create and populate the tables it attached to the end of the post.

First up, a simple exists query, in an IF, just to be different.

IF EXISTS (SELECT 1 FROM PrimaryTable_Medium)
PRINT 'Exists'

IF EXISTS (SELECT TOP (1) 1 FROM PrimaryTable_Medium)
PRINT 'Exists too'

For a benchmark, a SELECT 1 FROM PrimaryTable_Medium has the following IO characteristics

Table ‘PrimaryTable_Medium’. Scan count 1, logical reads 89, physical reads 0.

SQL Server Execution Times:
CPU time = 15 ms,  elapsed time = 510 ms.

Ignore the elapsed time, that’s likely mostly from displaying the records. I’m going to focus mostly on the CPU and IO.

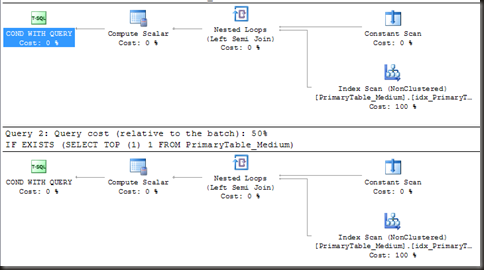
Execution plans of the two exists variations are absolutely identical.

TopExists1

The index operators are scans because there is no way they could be anything else, there’s no predicate so a seek is not possible. That said, it’s not a full index scan. The properties of the Index Scan show 1 row only (actual and estimated). So SQL did not read the entire index, just enough to evaluate the EXISTS, and that’s what it did in both cases. IO stats confirm that.
(more…)

Statistics, row estimations and the ascending date column

SQL’s auto-updating statistics go a fair way to making SQL Server a self-tuning database engine and in many cases they do a reasonably good job

However there’s one place where the statistics’ auto-update fails often and badly. That’s on the large table with an ascending column where the common queries are looking for the latest rows.

Let’s have a look at a common scenario.

We have a large table (imaginatively called ‘Transactions’) with a date time column (even more imaginatively called ‘TransactionDate’). This table gets about 80,000 new records a day and currently has around 8,000,000 records in it. So we can say roughly that another 1% is added to the table size daily. No records are updated and there’s a monthly purge of old data so that the total size remains about the same. A reasonably common real-life scenario.

CREATE TABLE Accounts (
AccountID INT IDENTITY PRIMARY KEY,
AccountNumber CHAR(8),
AccountType CHAR(2),
AccountHolder VARCHAR(50),
Filler CHAR(50) -- simulating other columns
)

CREATE TABLE Transactions (
TransactionID INT IDENTITY PRIMARY KEY NONCLUSTERED,
AccountID INT NOT NULL FOREIGN KEY REFERENCES Accounts (AccountID),
TransactionDate DATETIME NOT NULL DEFAULT GETDATE(),
TransactionType CHAR(2),
Amount NUMERIC(18,6),
Filler CHAR(150) -- Simulating other columns
)
GO
CREATE CLUSTERED INDEX idx_Transactions_TransactionDate
ON Transactions (TransactionDate)

CREATE NONCLUSTERED INDEX idx_Transactions_AccountID
ON Transactions (AccountID)

CREATE NONCLUSTERED INDEX idx_Accounts_AccountType
ON Accounts (AccountType)

-- Using RedGate's SQLDataGenerator to generate some data for this.

Accounts Transactions

Day 1 of the month, the indexes have just been rebuilt (after the data purge) and the statistics associated with those have been updated. The latest value in the TransactionDate column is ‘2011/01/31’ and the last value in the statistics histogram is ‘2011/01/31’. Life is good.

Day 2 of the month, there have been 80,000 new records added for the previous day. Only 1% of the table has been updated, so the automatic statistics update would not have triggered. The latest value in the TransactionDate column is ‘2011/02/01’ and the last value in the statistics histogram is ‘2011/01/31’. Doesn’t look like a problem.

Fast forwards another couple of days. Day 5 of the month. By this point 300,000 rows have been added since the beginning of the month. This amounts to around 5% of the table. Hence the statistics auto-update (triggered at 20%) still would not have run. The latest value in the TransactionDate column is ‘2011/02/04’ and the last value in the statistics histogram is ‘2011/01/31’. Starting to look less than ideal.

So, what kind of effect does this have on the queries against that table? (more…)

Are int joins faster than string joins?

This one comes up a lot on the forums, often as advice given…

“You should use integers for the key rather than strings. The joins will be faster.”

It sounds logical. Surely integers are easier to compare than large complex strings. Question is, is it true?

This is going to take lots and lots of rows to get any significant results. I’m going to do two sets of tests. The first comparing query execution speed between string and integer data types on the join column while keeping the size of the join column the same between the two. This is to tell if there’s a difference just because of the data type.

The second test will have both the data type and the size of the join columns differing, while the total size of the table row will be kept the same. This is to answer the ‘string joins are slower because they are larger’ argument.

Test 1: Same key size, no indexes

The two tables have the same size join column – a bigint in one and a char(8) in the other.

SELECT t1.ID, t2.ID, t1.IntForeignKey, t2.SomeArbStatus
FROM dbo.TestingJoinsInt t1
INNER JOIN dbo.LookupTableInt t2 ON t1.IntForeignKey = t2.ID
GO

SELECT t1.ID, t2.ID, t1.StrForeignKey, t2.SomeArbStatus
FROM dbo.TestingJoinsString t1
INNER JOIN dbo.LookupTableString t2 ON t1.StrForeignKey = t2.ID
GO

First up, a check of what Statistics IO and Statistics Time show for the two and whether there’s any difference in execution plan. (Full repo code is available for download, link at the end of the post)

Int joins

Table ‘Worktable’. Scan count 0, logical reads 0, physical reads 0.
Table ‘TestingJoinsInt’. Scan count 1, logical reads 66036, physical reads 0.
Table ‘LookupTableInt’. Scan count 1, logical reads 735, physical reads 0.

SQL Server Execution Times:
CPU time = 2433 ms,  elapsed time = 32574 ms.

IntJoins1

String joins

Table ‘Worktable’. Scan count 0, logical reads 0, physical reads 0.
Table ‘TestingJoinsString’. Scan count 1, logical reads 66036, physical reads 0.
Table ‘LookupTableString’. Scan count 1, logical reads 735, physical reads 0.

SQL Server Execution Times:
CPU time = 3744 ms,  elapsed time = 33947 ms.

StringJoins1

(more…)

Is a clustered index best for range queries?

I see a lot of advice that talks about the clustered index been the best index for use for range queries, that is queries with inequalities filters, queries that retrieve ranges of rows, as opposed to singleton queries, queries that retrieve single rows (including, unfortunately, a Technet article).

I suspect the reasoning behind this advice is the idea that the clustered index stores the data in order of the clustering key (ack) and hence it’s ‘logical’ that such a structure would be best for range scans as SQL can simply start at the beginning of the range and read sequentially to the end.

Question is, is that really the case?

Let’s do some experiments and find out.

CREATE TABLE TestingRangeQueries (
ID INT IDENTITY,
SomeValue NUMERIC(7,2),
Filler CHAR(500) DEFAULT ''
)

-- 1 million rows
INSERT INTO TestingRangeQueries (SomeValue)
SELECT TOP (1000000) RAND(CAST(a.object_id AS BIGINT) + b.column_id*2511)
FROM msdb.sys.columns a CROSS JOIN msdb.sys.columns b

-- One cluster and two nonclustered indexes on the column that will be used for the range filter

CREATE CLUSTERED INDEX idx_RangeQueries_Cluster
ON TestingRangeQueries (ID)

CREATE NONCLUSTERED INDEX idx_RangeQueries_NC1
ON TestingRangeQueries (ID)

CREATE NONCLUSTERED INDEX idx_RangeQueries_NC2
ON TestingRangeQueries (ID)
INCLUDE (SomeValue)
GO

The query that I’ll be testing with will do a sum of the SomeValue column for a large range of ID values. That means that of the three indexes that I’m testing, one is clustered, one is a nonclustered that does not cover the query and the third is a covering nonclustered index.

SELECT SUM(SomeValue)
FROM TestingRangeQueries
WHERE ID BETWEEN 20000 and 200000 -- 180 001 rows, 18% of the table

I’m going to run the same range scan query three times, each with an index hint so that SQL will use the three different indexes, regardless of which one it thinks is best.

First up, the clustered index.

As expected, we get a clustered index seek (the predicate is SARGable) and a stream aggregate.

ClusteredIndex

Table ‘TestingRangeQueries’. Scan count 1, logical reads 12023, physical reads 0.

SQL Server Execution Times:
CPU time = 94 ms,  elapsed time = 110 ms.

(more…)

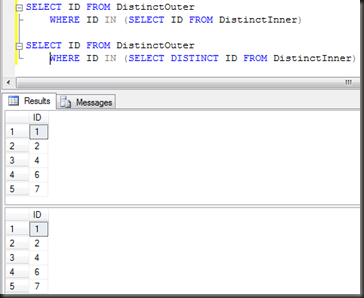
Distincting an IN subquery

This is going to be a quick one…

I keep seeing forum code (and production code) that includes the DISTINCT in IN or EXISTS subqueries. The rationale is given either as a performance enhancement or as necessary for correct results.

Is it necessary or useful? Only one way to find out.

Let’s check for correct results first, because that can be done with nice small tables.

CREATE TABLE DistinctOuter (
ID INT
);

CREATE TABLE DistinctInner (
ID INT
);

INSERT INTO DistinctOuter
VALUES (1), (2), (3), (4), (5), (6), (7), (8)

INSERT INTO DistinctInner
VALUES (1), (2), (2), (2), (2), (4), (6), (7)

DistinctIN

(more…)

Hit and miss

Or “Monitoring plan cache usage

For people interested in the details of how SQL is using and reusing execution plans, there are some useful events in profiler for watching this in detail, under the Stored procedure group:

  • SP:CacheMiss
  • SP:CacheInsert
  • SP:CacheHit
  • SP:CacheRemove
  • SP:Recompile
  • SP:StmtRecompile

Additionally there’s the SQL:StmtRecompile event under the TSQL group.

For now, I just want to look briefly at the CacheMiss and CacheHit events.

One word of caution early on, these are frequently occurring events and it may not be a good idea to trace these on busy production servers. If you do need to, keep the duration of the trace short and the columns to a minimum.

CacheEvents

CacheMiss

The cache miss event fires any time SQL looks for the execution plans for an object or ad-hoc batch and does not find it in the plan cache.

For an object (scalar function, multi-statement table-valued function, stored procedure or trigger) the match is done on the object ID (along with some of the connection’s SET options and possibly the database user and c couple other factors1). For an ad-hoc batch, the match is done on a hash of the text of the batch (along with some of the connection’s SET options and possibly the database user)

When testing stored procedures from Management Studio (or another SQL querying tool), two CacheMiss events will appear in the trace.

CacheMiss

What’s going on here?

(more…)

The Root of all Evil

Or “Shot gun query tuning

There have been a fair few forums questions in recent months asking for help in removing index scans, loop joins, sorts or other, presumed, slow query operators. There have been just as many asking how to replace a subquery with a join or a join with a subquery or similar aspects of a query usually for performance reasons.

The first question that I have to ask when looking at requests like that is “Why?”

Why is removing a particular query operator the goal? Why is changing a where clause predicate the goal? If it’s to make the query faster, has the query been examined and has it been confirmed that query operator or predicate really is the problem?

The title of this post refers to a comment I’ve seen again and again in blogs or articles about front-end development. “Premature optimisation is the root of all evils.” It’s true in the database field as well.

(more…)

The most optimal join type

What’s the best join type for a query? Should we aspire to seeing nested loop joins in all our queries? Should we tremble with horror at the sight of a hash join?

Well, it depends. 🙂

There’s no single join type that’s best in every scenario and there’s no join type that’s bad to have in every scenario. If one of the join types, say the much maligned hash join, was very much a sub-optimal join type in every single scenario, then there would be no reason for it to be in the product and no reason for the optimiser to ever select it for a plan. Since there are three join types, and the optimiser can and does use all three, we must assume that they are all useful under some circumstances.

I took a look at the joins a while back, but it’s worth revisiting.

The nested loop join

A nested loop join is an optimal join type when two conditions are true.

  1. One of the resultsets contains quite a small number of rows.
  2. The other table has an index on the join column(s).

When both of these are true, SQL can do a very efficient nested loop. The smaller resultset becomes the outer table of the join, a loop runs across all the rows in that resultset and index seeks are done to look up the matching rows in the inner table. It’s important to note that the number of seeks against the inner table will not be less than the number of rows in the outer table, at the point the join occurs

If the one resultset has a small number of rows but there is no index on the other table on the join column, then a loop join can still be done, but is less optimal as the entire of the inner table (or a subset based on another filter condition) must be read on each iteration of the loop.

If both resultsets have large numbers of rows but there is an index on the join columns in one of the tables then the nested loop can still read through one of the resultsets and do index seeks to locate matching rows, but the number of rows in the outer table will mean lots and lots of seek operations, which may result in a sub-optimal plan.

(more…)

Multiple Execution Paths

It’s not uncommon to find stored procedures that have multiple IF statements controlling the flow of execution within the procedure. Now this seems to be a fairly logical thing to do, but there can be a subtle performance problem with this, one that may be hard to identify.

Let’s have a look at a simple example (using AdventureWorks)

CREATE PROCEDURE MultipleExecPaths (
@TransactionType char(1) = NULL
)
AS

IF @TransactionType IS NULL
SELECT max(transactionDate) from Production.TransactionHistory
ELSE
SELECT max(transactionDate) from Production.TransactionHistory
WHERE TransactionType = @TransactionType

GO

Nice and simple. If the parameter is passed, get the latest date for that transaction type, if the parameter is not passed, ie is null, get the latest date over all transaction types. So what’s wrong with this?

The problem goes back to parameter sniffing. When the procedure is first executed the first time all queries in the procedure are parsed, bound and optimised. When the optimiser processes each statement to generate an execution plan it uses the values passed for the various parameters to estimate the number of rows affected. The number of rows that the optimiser thinks the queries will process affects the choice of operators for the plan. Operators that are optimal for small numbers of rows are not always optimal for large numbers of rows, and sometimes the difference can be astounding.

Let’s see how the example above plays out  to understand what’s happening here.

(more…)

Functions, IO statistics and the Execution plan

It’s no secret that I’m not overly fond of most user-defined functions. This isn’t just a pet hate, I have some good reasons for disliking them. All too often they’re performance bottlenecks, but that can be said about many things in SQL. The bigger problem is that they’re hidden performance bottlenecks that often go overlooked and ignored for too long.

I’m going to start with this fairly simple scalar function, created in the AdventureWorks database

Create function LineItemTotal(@ProductID int)
returns money
as
begin
declare @Total money

select @Total = sum(LineTotal) from sales.SalesOrderDetail where productid = @ProductID

return @Total
end

So, given that function, the following two queries should be equivalent.

SELECT productid, productnumber, dbo.LineItemTotal(productid) as SumTotal
FROM Production.Product p

SELECT productid, productnumber,
(select sum(LineTotal) from sales.SalesOrderDetail where productid = p.productid) AS SumTotal
FROM Production.Product p

No problems so far. They both return 504 rows (in my copy of AW, which has been slightly padded out with more data). Now, let’s look at the execution characteristics by running them again with Statistics IO and Statistics Time on.

Query 1, the one with the scalar function:

Table ‘Product’. Scan count 1, logical reads 4, physical reads 0.

SQL Server Execution Times:
CPU time = 47297 ms,  elapsed time = 47541 ms.

Query 2, the one with the correlated subquery:

Table ‘Worktable’. Scan count 0, logical reads 0, physical reads 0.
Table ‘SalesOrderDetail’. Scan count 3, logical reads 22536, physical reads 0.
Table ‘Product’. Scan count 3, logical reads 40, physical reads 0.

SQL Server Execution Times:
CPU time = 1047 ms, elapsed time = 1249 ms.

(more…)