One last post on execution plans and Profiler (at least for now)
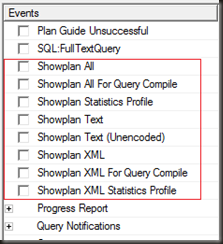
When trying to check a query’s execution plan, the display execution plan option of Management Studio is usually adequate, however there are occasions where it’s either not feasible to run the query from Management Studio or the particular behaviour can’t be reproduced in Management Studio (perhaps because of different SET options). For cases like this it may be necessary to capture the execution plans via SQL Trace. Fortunately there are events for execution plans. Eight of them, to be precise, all under the Performance folder.
Great, so there’s no shortage of options available. But what are the differences between them?
Showplan All
According to Books Online:
The Showplan All event class occurs when Microsoft SQL Server executes an SQL statement. Include this event class to identify the Showplan operators on Microsoft SQL Server 2000 or Microsoft SQL Server 7.0. This event class will also work on SQL Server 2005 and later; however, the information included is a subset of the information available in the Showplan XML Statistics Profile or Showplan XML event class.
So in other words this one is not generally the event that we should be looking at on the latest versions of SQL. It’s not deprecated however (at least not in SQL 2008), so it is still usable on the later versions if you absolutely want.
The plan is in text format and hence it will be smaller than the XML format plan (like the one produced by Management Studio’s “include execution plan” option). Important to note is that the run-time statistics (eg “Actual row count”) are not present in this event. What is present is the text form of the plan, the estimated row counts for each operator, physical and logical operator names, any details of what the operator operated on, estimated rows, executions, IO and CPU costs, row size and some costs.
The event fires once per query executed, so if a single query is executed four times, the event will fire four times.
Also worth noting is that for all of the Showplan events, the BinaryData column must be included in the trace, as without that the plan will not be captured.
Showplan All for Query Compile
Very similar to the Showplan All event in appearance, the difference from the Showplan All event is when it fires. While Showplan All fires on query execution, Showplan All for Query Compile event fires when the query is optimised, not executed. Hence run the query four times and the Showplan All for Query Compile event will fire once, not four times (assuming that the plan is not already in cache and nothing forces a recompile on any of the executions)
Like with the Showplan event, there is no run-time information. This shouldn’t be surprising, since the event fires at query compile, not execution.
Showplan Statistics Profile
Again, very similar to the Showplan All event in appearance. As with Showplan All event, the Books Online entry indicates that this is more use against SQL 7 and 2000 servers.
This is the first event that we’ve looked at that does contain the run-time information, specifically the execution count and row count for each operator.
Showplan Text
This is the event that produced the least information of all of the plan events. Books Online has a similar, but longer, note as for Showplan All.
The Showplan Text event class occurs when Microsoft SQL Server executes an SQL statement. Include this event class to identify the Showplan operators on SQL Server 2000 or SQL Server 7.0. This event class works on SQL Server or later, however the information included is a subset of the information available in Showplan All, Showplan XML Statistics Profile or Showplan XML event class.
All that this event shows is the text form of the plan. No estimated or actual statistics are included, no costs are available, no details of operator names or details.
This may be useful if there’s a need for a long-term trace for execution plans, since it’s the smallest amount of information it will result in the smallest files and lowest impact.
Showplan Text (Unencoded)
This event shows exactly the same information as Showplan Text does. The only difference is that the plan is formatted as a string and placed into the TextData column instead of the BinaryData column as with previous events.
Showplan XML
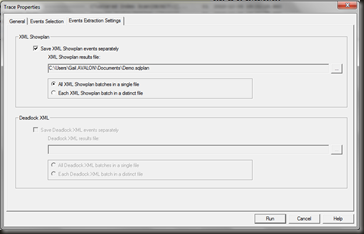
The XML plan events are the ‘new’ events, first appearing in SQL 2005. One thing of interest with these events is that the resulting plans don’t have to be stored in the trace file, there is an option (with the profiler GUI that is) to save them into separate files. This is only an option when using the Profiler GUI, a server-side trace has no such capability.
With this event, the plan is stored in the textdata column, so the BinaryData column is not required, unlike with the Showplan All events.
Like with the Showplan All event, this event contains no run-time information. It has only the compile time information, much as the ‘Display Estimated Execution Plan’ option in Management Studio.
The event fires once per query executed, so if a single query is executed four times, the event will fire four times.
Showplan XML for Query Compile
Almost identical to the Showplan XML event, the difference is that this event fires on query compile rather than query execution. Hence run the query four times and the Showplan XML for Query Compile event will fire once, not four times.
Showplan XML Statistics Profile
This is pretty much the top of the execution plan events – the full XML execution plan, with all compile- and run-time information on each execution of the query.
Of course, as the largest of the plan events it’s going to have an impact on the server and as such should be traced with caution. It’s also going to result in large trace files if run for any length of time. Test first before running a trace against a busy production server.


Tx Gail
Your welcome. Sorry it took so long to get to this.
This is awesome! You should think about doing something like this for the next MVP Deep Dives book. 🙂
Thanks Kalen.
You can also do this directly in SQL:
set showplan_all on
go
(insert query here)
go
set showplan_all off
go
Yup (and there are several showplan options), this was specifically about profiler. Sometimes you can’t run the query again to get the exec plan.
Thanks gail nice plan.
Thanks for the wonderful post. Gail i am still fighting to get an answer onto which SET options takes in effect. Does the SET option from .net client overwrite the SET option inside a stored proc when it is called from the app?In our .NET client isolation level is read committed and inside stored proc it is set to read uncommitted. Which one takes effect? Thanks
Test it. The Profiler event Audit Login event shows all the settings. In the execution plan, the SELECT operator (the one on the left) shows all the settings. Pull out the plan and see what settings were in place.
Far better to test and prove than to take someone’s word for it.
For isolation levels, the latest setting is the effective one. Sure you want read uncommitted (potentially inconsistent and maybe duplicated data)?